Name ________________________

A project in Rates of Change
50 points test points and 100 project points
[Data Collection Log] [Report Outline]
[Prediction Shee]
[Spreadsheet]
[Evaluation Sheet] [Project Overview]
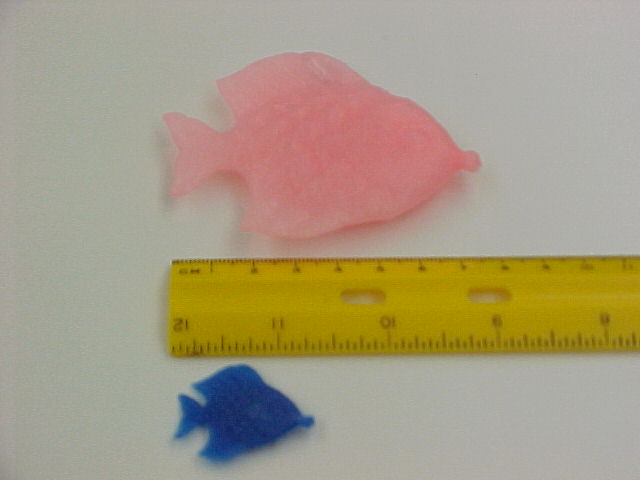
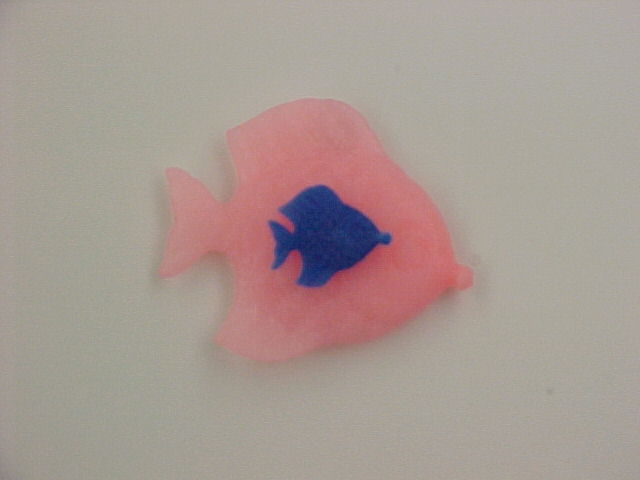
This project will give you a great opportunity to grow your own creature and gain information about similarity and rates of change. It will require you to collect FOUR days of data about your creature. You will be growing it and then shrinking it back. You will be using a spreadsheet (EXCEL) and a word processor (MS WORD) to generate your final report that will include charts and graphs of your data.
Grow your creature for a minimum of 48 hours. If it fails to grow within the four hours past the minimum 48 hours, you may take it out of the water and begin the shrinking process. If your creature continues to grow without any indication of slowing down, take it out of the water at noon on day 3 (55 hours old). Note on your log when the creature is removed from the water for good.
Data must be collected on the log sheets that have been provided and should take place NO CLOSER THAN ONE HOUR apart – preferably every one to two hours.
Throughout the data collection period, you are to make tracings of your creature. You should trace it before you begin. When you take it out of the water to shrink it, dry it off, and trace it at its "biggest" point. When it has stopped shrinking, trace it once again. Label each picture with the age of the creature, its length, its width, and it’s thickness. Then attach these drawings to your final report
For 15 points (out of 25) on the data collection part of this project, you must have at least 9 data measurements per day on each of days 1, 2, 3, and 4 - each must be taken no closer than 1 hour apart.
For 20 points on the data collection part of this project, you must have at least 11 data measurements per day on days 1, 2, 3, and 4 – each must be taken no closer than 1 hour apart.
For 25 points on the data collection part of the project, you must have at least 13 data measurements per day on days 1, 2, 3, and 4 – each must be taken no closer than 1 hour apart.
No later than Friday, January 5th,
- You will post your data (as an excel file attachment if you have excel and as a list of data for people that don’t have access to excel!) to the Calculus Web board found at:
http://webboard.district87.org/~apcalculus
Note: If you don’t have access to email, you MUST bring your data to Mr. Dederich on THURSDAY (January 4 – end of 2nd hour) so that it can be copied for distribution in Friday’s class.
You will graph your data and also make additional graphs of the entire class data -collected by you and your classmates. Your report should follow the form on your report outline sheet and evaluation sheet.
EXTRA Credit:
- After your reflections in your report, add a section called Applications of Rates of Change. Describe up to two different real-world situations where rates of change would be crucial to know. Tell what the application is, where or in what industry it would be important, how the rates would be measured – include units used, and who would use this information. (10 points possible for each application – 20 points maximum.)
- Add derivative graphs for your class data. (20 points maximum)
[Data Collection Log] [Report Outline]
[Prediction Shee]
[Spreadsheet]
[Evaluation Sheet] [Project Overview]
|


