|
Graphing
and Analyzing Our School’s Attendance
Project URL: attendance.htm
Purpose of the project:
This project will serve two main instructional purposes.
First, it will create a sense of community and will help students
understand their school and the community around them. Second, it is a
great way to introduce major concepts such as histograms, pie graphs, and
many other statistical concepts that sometimes seem totally abstract.
How it works:
This project will be done in three days,
possibly four. The first day students will be introduced to the project
and to their school attendance data. In the next few days, students will
work on the computer and away from the computer in order to create their
presentation. Some of the students will decide not to use any software and
they will only use the graphing calculator to print their graphs.
Standards addressed:
Math:
Organize data
Interpret representation of data, compare distribution of data and
critique conclusions
Technology:
Students use productivity tools to collaborate
in constructing technology-enhanced models, prepare publications, and
produce other creative work.
Students use technology tools to process data and report results
English Language Arts:
Read and comprehend authentic documents
Write
reports using correct conventions and grammar
Computer Applications:
The different software that may be used in this project are: Power
Point 5.0, Excel, Word
Other technology: LCD Projector, Overhead Projector, TI-83
graphic calculator
The Students:
100 ninth-grade students participated in the project. The students
were all enrolled in Math A. Students met for about three days to complete
the project. They worked both in the classroom and in the computer lab.
Overall Value:
Students in urban schools encounter a variety of obstacles to academic
achievement. Students feel more and more that “The School” is
obsolete, and they do not see the correlation between concepts learned in
their classes and real world application. Students working on this
project will understand the relevance of schooling and will also build
their self
esteem because they will take an active part in their learning process and
in their school’s administrative work. Bubble sheet attendance ratings
are “stuff” that only the assistant principal and the principal look
at. With this project,
students will take responsibility for their school’s reputation and
success, not only as students, but also as active learners who use their
knowledge to make the school a better place.
Tips:
The project can be adapted to any age group. The best part of this
project is that it makes students aware of their attendance and the
community around them.
Evaluation rubric: attrubric.htm
|
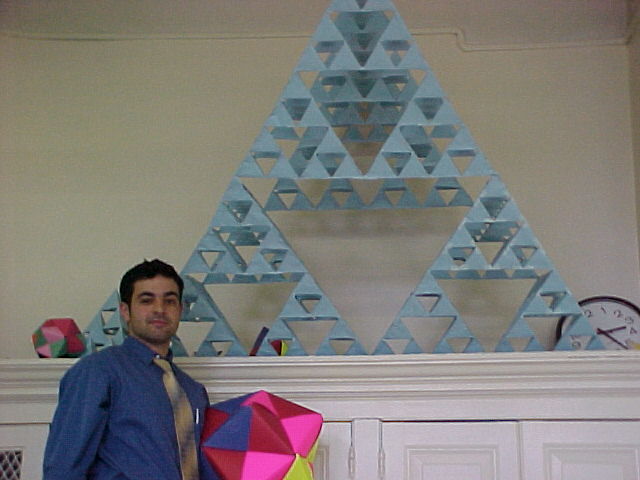
About The Teacher
Francesco Ianni teaches mathematics at
University Neighborhood High School. Francesco
is always in search of new, different ways to reach “at-risk”
students. His teaching integrates technology and hands-on activities,
where students can really discover on their own that math is all around
us.
Together with his mentors, Francesco led a workshop
at the NYU ACTIII Conference in May entitled “Electronic Communications
and the 3R’s: Reading,
Writing, and Arithmetic”. He
demonstrated technology lessons and resources they developed this year to
target Math and ELA performance standards.
Email Contact: cicco@mindspring.com
Estimated Class Periods To Complete: 3-4
class periods, including 2 days in the computer lab
Subject:
Algebra,
Statistics, Technology
Beginning Grade Level: 9
Ending Grade Level: 12
|


