Isopod Lab
If
you'd like this page as a PDF file, click
here.
BIOLOGY
INVESTIGATION
EXPERIMENTAL DESIGN
|
NAME_____________________________
DATE____________________PER_______ |
NC Standard
Course of Study:
Competency Goal 5: Students will develop an understanding of the
behavior of organisms, resulting from a combination of heredity
and environment.
PURPOSE
• to study the responses of the common pill bug (sow bug,
isopod) to a variety of solutions.
• to analyze the various parts of an experiment
PART I –
Follow the given procedure for this part of the lab.
INITIAL OBSERVATIONS:
Land isopods (including sow bugs and pill bugs) live in dark, moist
places beneath undisturbed objects lying on the ground -- rotting
logs, boards, bricks, or rocks. Sometimes isopods can be found alongside
buildings where there is moisture and food (decaying matter, fungi).
Living organisms, in general, avoid some chemicals and are attracted
to others.
| MATERIALS: |
|
4
sow bugs or pill bugs
petri dish
paper towel or filter paper
droppers
|
water
1% solution of salt
1% solution of sugar
1% solution of vinegar
|
HYPOTHESIS: Read the procedure for this experiment. State one hypothesis
that is being tested by this experiment. Your hypothesis might answer
the question: Which chemicals will attract or repel the isopods
and why?
(hypothesis)_____________________________________________________________
_______________________________________________________________________
PROCEDURE:
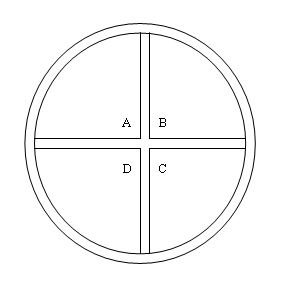
1. Cut paper toweling or filter paper to fit a petri dish as
shown in this diagram. Leave about 0.5 cm between the pieces
of paper.
2. Label the four sections A, B, C, and D.
3. Place drops of solution on the sections
of towel. Be sure that the paper is totally wet BUT that no
solutions run together. The paper pieces should lie flat on
the petri dish. A= water, B = salt solution, C = sugar solution,
D = vinegar
solution
4. Place 4 isopods in the middle and begin
recording where they are every 15 seconds for 5 minutes.
|
 |
OBSERVATIONS:
Record general
observations about the isopods here: What do they look like? How
do they move? How do they appear to "sense" their environment?
Etc.
DATA CHART FOR
ISOPOD EXPERIMENT: (Record the number of isopods on each section
at the time indicated)
Time |
A
- water |
B
- salt |
C
- sugar |
D
- vinegar |
In
between |
0
seconds |
|
|
|
|
|
15 |
|
|
|
|
|
30 |
|
|
|
|
|
45 |
|
|
|
|
|
1
minute |
|
|
|
|
|
15 |
|
|
|
|
|
30 |
|
|
|
|
|
45 |
|
|
|
|
|
2
minutes |
|
|
|
|
|
15 |
|
|
|
|
|
30 |
|
|
|
|
|
45 |
|
|
|
|
|
3
minutes |
|
|
|
|
|
15 |
|
|
|
|
|
30 |
|
|
|
|
|
45 |
|
|
|
|
|
4
minutes |
|
|
|
|
|
15 |
|
|
|
|
|
30 |
|
|
|
|
|
45 |
|
|
|
|
|
5
minutes |
|
|
|
|
|
Total
for each solution |
|
|
|
|
|
Time |
A - water |
B - salt |
C - sugar |
D - vinegar |
In between |
| Class Average for each solution |
|
|
|
|
|
Create a Bar
Graph showing the Class Averages for each solution.
CONCLUSIONS:
1. What parts
of the experiment are controlled?
2. What are
the variables?
3. Was your
hypothesis supported? Use the data to explain your answer.
4. Use what
you know about organisms, cells, and homeostasis to explain your
results.
5. What are
the survival advantages for the behavior that you observed?
6. How could
this experiment be improved?
PLAN YOUR OWN
EXPERIMENT:
Now, design
your own experiment to test the response of pill bugs to some other
environmental conditions such as light versus dark, dry versus moist,
different concentrations of the same solution, different solutions,
or something else that you are curious about. Be sure to include
all the parts of a good experimental design.
a. List the
relevant initial observations.
b. State your hypothesis
c. List your
materials
d. Give the
steps of your procedure.
e. Create a
NEAT data chart and graph and attach them to this lab report.
f. What is the
control?
g. What are
the variables?
h. What are
your conclusions? Be sure to cite your data and explain your results.
i. What would
you do differently, if you could redesign your experiment?
Next
=>> Instructions
for Writing Lab Reports
To the Scientific
Inquiry Main page |


