 Subject: Math, Technology Subject: Math, Technology
Grade Level: 5th grade
Materials: Computers with Internet access and MS Excel software, printer, projector, student worksheets, teacher-created charts, graphs, sample survey, pencils, paper
About: Students learn to formulate survey questions, make predictions, collect data, and use MS Excel to represent their data and report their findings.
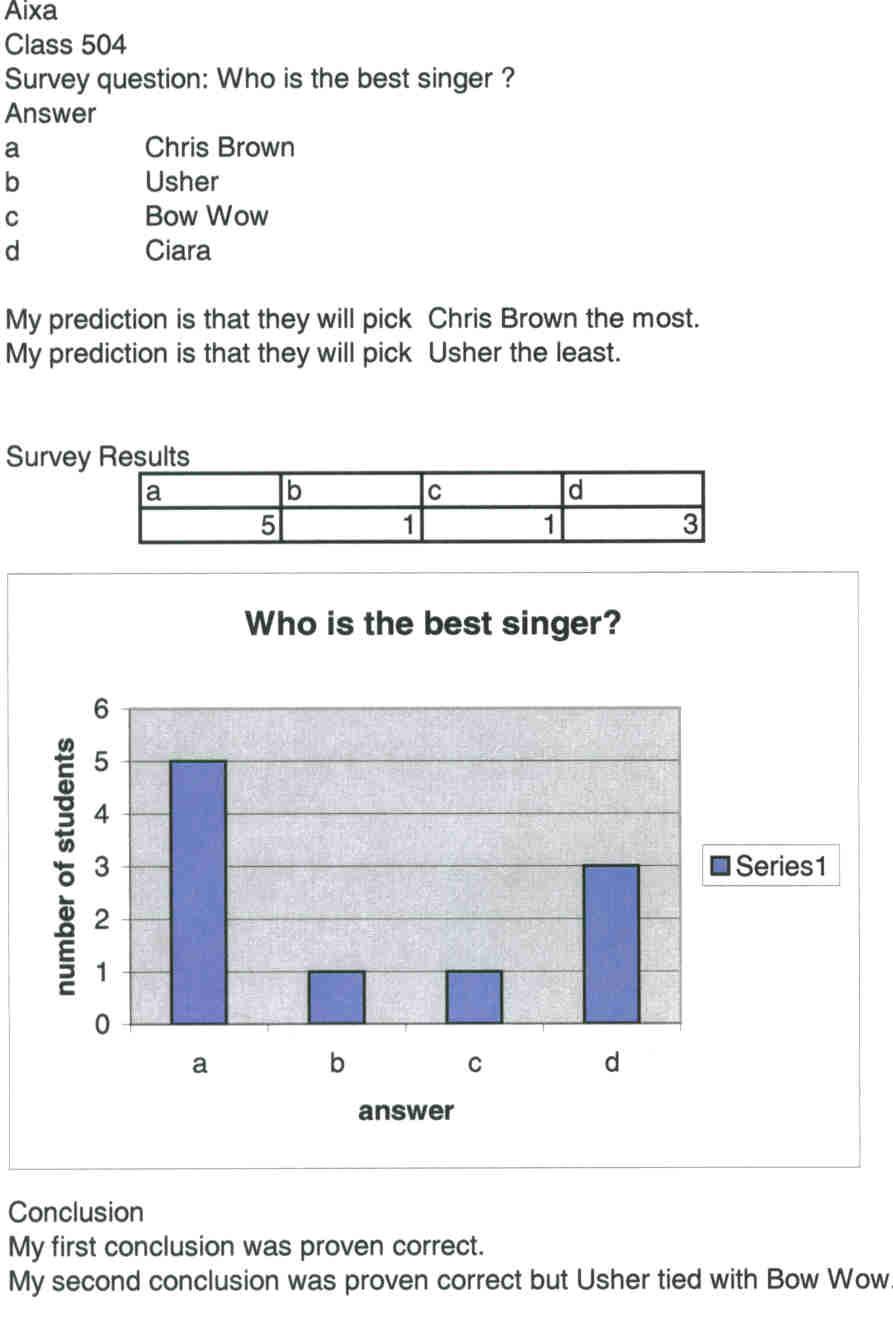
For their final project, the students print out their data, graph, survey questions, and predictions.
Data! Data! Graph That Data! introduces students to MS Excel, a valuable spreadsheet program for representing data. The project also enables students to see themselves as mathematicians who collect data and make predictions based on that data.
Teachers should create a sample survey question and graph the results in MS Excel so students can see what the final project should look like. Emphasize that they are mathematicians and should use language such as “My prediction is…” rather than “I think that…”
| Students will learn to collect data. |
| Students will learn to make predictions based on the data collected. |
| Students will learn spreadsheet program MS Excel to represent their findings. |
|
|
|
|
|
|
|
| If you do not have MS Excel, this free website allows for creating graphs online. Students can then use a word processing program to write their predictions, survey questions, etc. |
| http://nces.ed.gov/nceskids/createagraph/ |
|
|
|
|
|
|
|
|
|
|
|
|
|
|
|
| 5S.1: Students collect and record data from a variety of sources (newspapers, magazines, polls, charts, and surveys). |
| 5th grade |
| Math, Statistics, and Probability |
| 5.PS.7: Students represent problem situations verbally, numerically, algebraically, and/or graphically. |
| 5th grade |
| Math, Problem Solving |
| MST.5.E: Students use the computer as a tool for generating ideas and drawings. |
| 5th grade |
| Math, Science, and Technology |
|
|
|
|
|
|
|
|
|
|
|
|
|
|
|
|
|
|
|
|
|
|
|
|
|
|
|
|
| Day 1: Creating survey question/answers, and making predictions. |
| Students will create a survey question. |
| Students will make predictions using statements such as "My prediction is that people are more likely choose answer B" and "My prediction is that people are least likely to choose answer C." |
|
|
|
|
| Teacher-created survey worksheet |
| Computer with MS Excel |
| Projector |
| Pencils |
|
| The teacher shows the students what the final project students will look like, and uses a computer and projector to show the survey question, data table, prediction, conclusions, and graph. |
| Students use the survey worksheet to create survey question and answers. |
| Students make predictions using statements such as "People are more likely choose answer B" and "People are least likely to choose answer C." |
| Students ask 10 people their survey questions and record the data. |
|
|
|
|
|
|
|
| Students are assessed through teacher observation to ensure that they have completed the worksheet. |
|
| Day 2: How to use MS Excel |
| Students will learn to input data into MS Excel. |
| Students will learn to create a graph using MS Excel. |
|
|
|
|
| Teacher-created chart on creating a graph in MS Excel |
| Computers with Internet access and MS Excel software, projector |
| Teacher-created chart on MS Excel basics |
| Student work sheets |
|
| Show students how to open MS Excel. It is a good idea to have an icon on the desktop so students can double-click on it. |
| Discuss the Excel screen; use the MS Excel Basics chart to explain rows, columns, and cells in Excel. |
| Show students how to type their survey question/answers, predictions, and data table in MS Excel. |
| Show students how to access the chart wizard (refer to MS Excel Creating a Graph chart). |
| Go through each of the steps of the chart wizard to create a graph. |
| Show students how to save their work (Click on File-Save-Name your file-Click on Save). |
| Students use MS Excel to input their data in a table format and generate their graphs. |
|
|
|
|
| Students are assessed through teacher observations ensuring that they are entering the information correctly. |
|
| Day 3: How to Edit in MS Excel |
| Students will learn how to edit their work in MS Excel. |
| Students will learn how to add color to their graphs. |
|
|
|
|
| Computers with MS Excel and Internet access, projector |
| Student work sheets |
|
|
|
| Show students how to open their work in MS Excel (File-Open-Click on file name-Click on Open). |
| Show students that to edit their work, they click on the cell they typed in and make the corrections in that cell, and then press Enter. |
| Show students how to add color to their graphs by having them right-click on the parts of the graph they want to add color to, and then click on Format. |
| Students follow the steps to edit and add color to their graphs. |
|
|
|
|
|
|
|
| Students are assessed through teacher observations ensuring that they are editing their work correctly. |
|
| Day 4: How to Print in MS Excel |
| Students will learn how to print their work. |
| Students will learn that what they see on the screen is not what they print. |
|
|
|
|
| Computers with MS Excel and Internet access, projector, printer, paper |
| Student work sheets |
|
|
|
| Show students how to open their work in MS Excel (File-Open-Click on file name-Click on Open). |
| Explain to students that what they see on the screen is not what they print. |
| Show students how to “preview” their work (File-Print Preview). |
| Explain that Print Preview allows them to see how their work will look when they print it. |
| Show them how to close the Print Preview window. |
| Show them how to print their work (File-Print-Click on Print). |
| Students follow the steps to preview their work and then print. |
|
|
|
|
| Student graphs will be assessed using the rubric. |
|
|
Annette Lopez
alopez6@schools.nyc.gov
PS 306
40 West Tremont Ave.
Bronx, NY 10453
Annette Lopez is the Technology Teacher at PS 306. She began teaching through the NYC Teaching Fellows Program after having worked in the computer field for 12 years. At PS 306 she teaches computers to students in grades 1-5. She has developed a technology curriculum that is project-based and integrates literacy, science, and social studies. She is the point person for all technology professional development for teachers at PS 306, making sure they use technology effectively in the classroom.
Important documents for this lesson plan.
|


