Procedure:
1. Using the same instructions they
used for the practice graphs, students will create two graphs, based on
their
survey results. They must input their information, rather than the information
contained in the instruction
worksheet.
2. Students will save the first graph as “Total Graph”
and the second graph as “Boys and Girls Graph.”
3. Student will
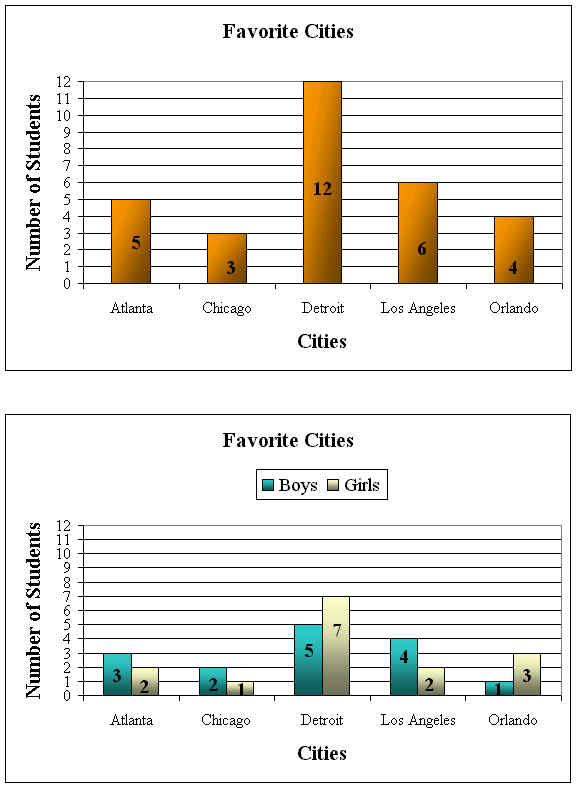
then copy and paste the two graphs on a single page in Microsoft Word. (sample)
4. The teacher will print one copy of the
graphs.
Evaluation:
The teacher will grade the graphs.
Points will be deducted for misspelled words and missing
information.
Lesson 5:
Presentation
Estimated Time:
3-5 class periods (55 minutes
each)
Objectives:
1. Students will use Microsoft
PowerPoint to present the results of their surveys.
2. Students
will follow the instructions given by the teacher, while viewing the
procedure on a
LCD projector.
3.
Students will import graphics (from clipart and the Internet) into the
slideshow presentation.
4. Students will import at least one of
their Microsoft Excel graphs into the slideshow
presentation.
Materials:
Computers (one per student) with Internet
access
Software Programs: Microsoft PowerPoint and Microsoft
Excel
Completed graphs
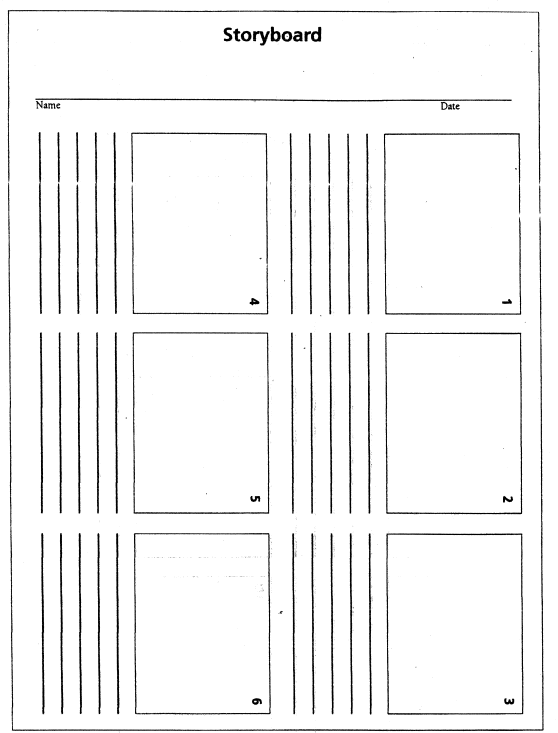
Planning sheet (6 slide minimum) (sample)
PowerPoint Presentation (sample)
3½" floppy disks
LCD
Projector
Procedure:
1. The teacher will show students a
sample slide show presentation.
2. The teacher will distribute
“planning sheets” to students.
3. Students will plan each slide
of their presentation.
4. Students will open Microsoft
PowerPoint.
5. Students will follow along (on their computers) as
the teacher illustrates (using the LCD projector) how to
create a multimedia presentation.
6. The teacher will show students how to:
a. Create a new presentation using Blank presentation.
b. Choose a
layout.
c. Add, move and delete
slides.
d. Insert, move, and delete
text.
e. Insert (from clipart and from
the Internet), move and delete graphics.
e. Spell Check and Save the
presentation.
f. Format
text.
g. Insert charts and
graphs.
h. Add transitions and
animations
i. View the completed
presentation.
Evaluation:
The teacher will grade the presentation
on:
1. Planning Sheet (organization)
2. Mechanics (spelling, punctuation,
and grammatical errors)
3. Technical
Requirements (correct number of slides and graphs, creativity, and
clarity)
4. Content (accuracy and
proficiency)

|


