Adapted By:
Dana Parentini
|
Ms. Parentini has been a classroom teacher for the past six years. She started her teaching career as a Teaching Fellow working in the Bronx where she taught kindergarten and second grade. She transferred about four years ago to PS 124 in Chinatown where she has taught third and fourth grades.
|
P.S. 124
New York, NY
|
|
|
Modifications
|
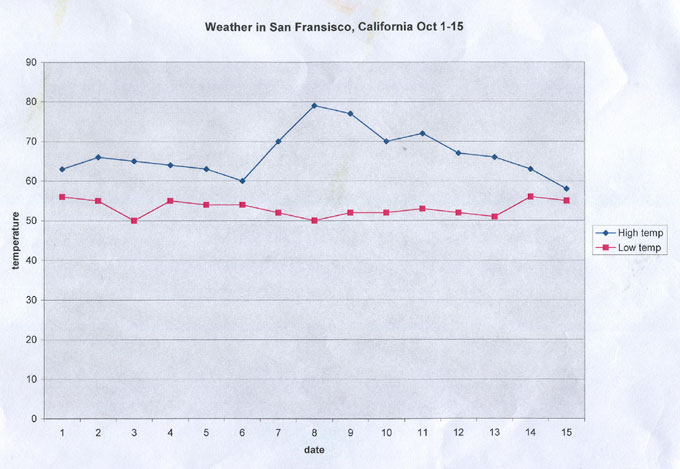
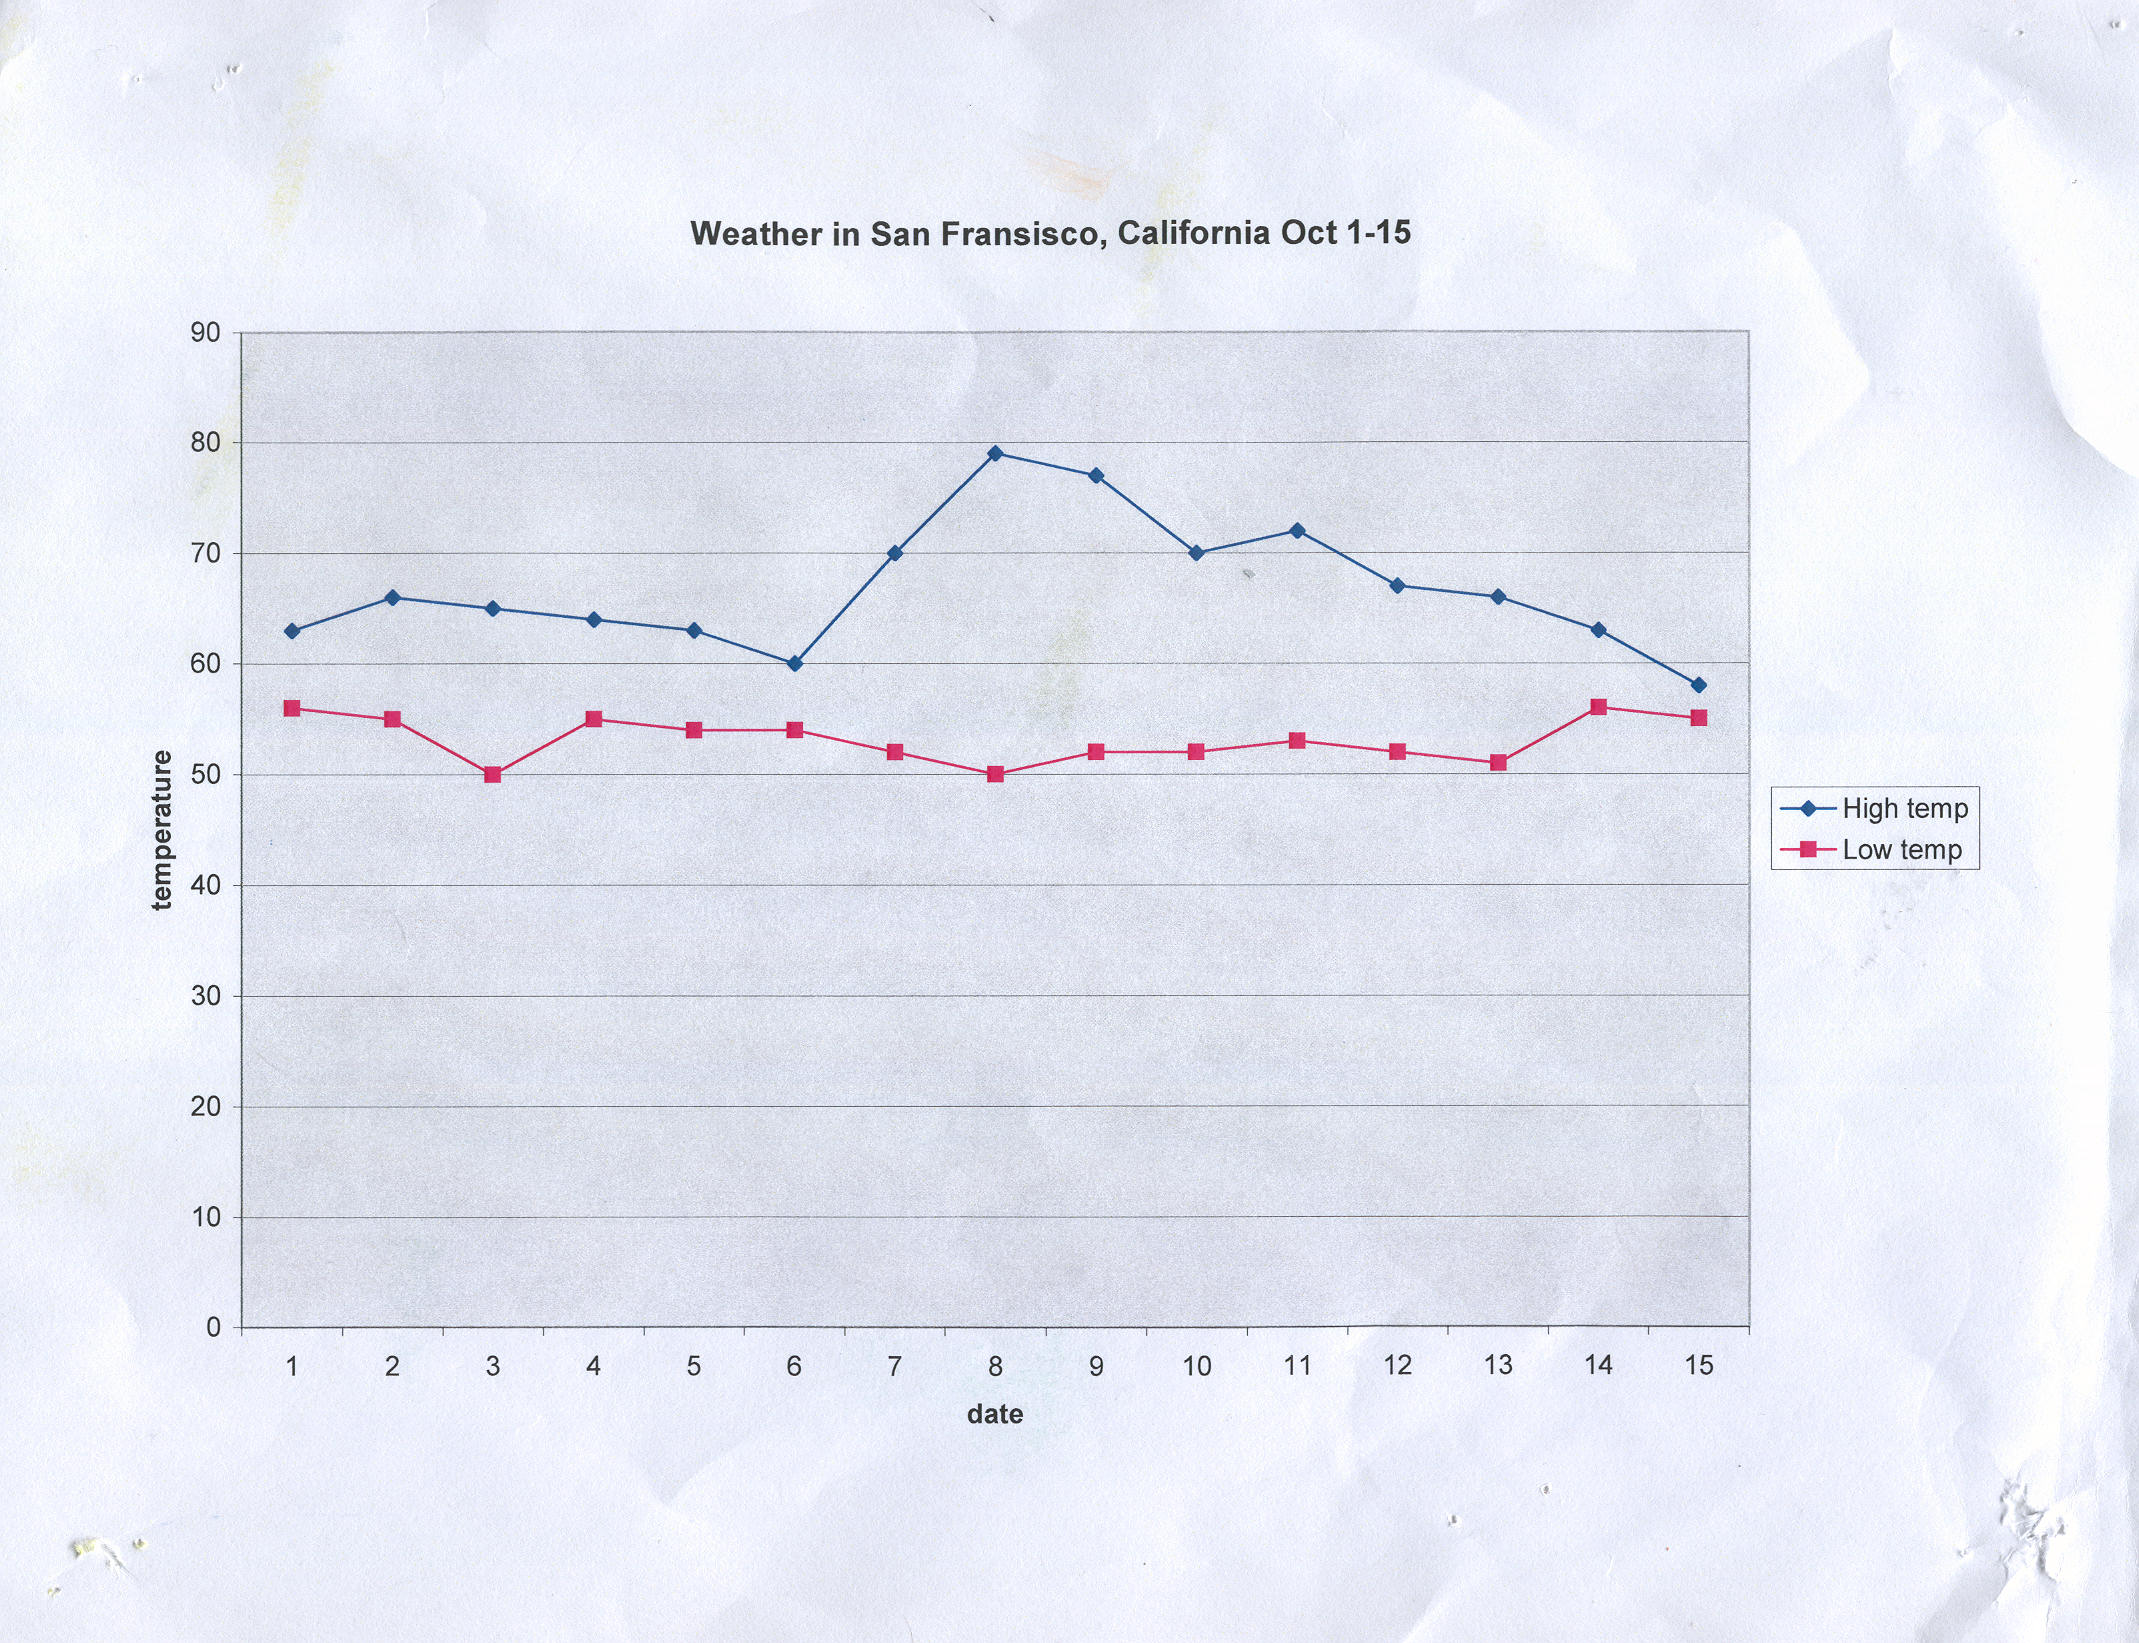
We started the unit by discussing the different regions of the United States. Students were paired up with a partner and each team had to choose one state they wanted to work on for different projects. Students started out with some general Internet research about their state. Students learned how to select key search words to find information. They also learned how to modify their search if they didn’t find what they were looking for. After the initial research, students located their states on a map. Then they worked with a partner creating a map of their state, which included important cities and places to visit. Partners then chose a city they wanted to learn about. Students conducted daily research about the high and low temperatures for their cities. They kept track of the temperatures on a simple chart in their notebooks. After two weeks, we used the collected data to make line graphs in Microsoft Excel. I modeled how to construct the graph in Excel using an instructional handout I made for the students. I chose a model city and constructed the graph with the students’ help. Once I finished the model graph, students worked with their partners to make their own graphs with the help of the instructional handout. Once all students completed their high and low temperature line graphs, they wrote their observations about the temperatures in their cities. We discussed the writing during a whole class meeting. The last part of the project included researching a place of interest within each group’s state. Once students chose a place they thought people might want to visit, each team researched information about this location on the Internet. We discussed note taking skills and students recorded information in their notebooks. Students wrote drafts in their writing journals to be included in their Power Point presentations. We spent some time discussing the different features they might want to include in the presentation, like pictures and important information. When the presentation was complete, our class invited other fourth grade classes to view the presentations on laptops. |
Instructional
Objectives
|
Students will increase their awareness about different states through research on the Internet.
Students will gather weather data for a city of their choice. They will monitor and record high and low temperatures for a two week period. Once temperatures are collected, students will construct line graphs using Microsoft Excel. Students will analyze the information based on the line graphs.
Students will become more fluent in Microsoft Excel and Microsoft Power Point by following instructional writing to help them with their projects.
Students will design Microsoft Power Point slide shows about their places of interest. Students will persuade the viewer to visit the place described by including information and features researched in books and on the Internet. |
Technology Integration
|
Throughout this unit, I wanted students to become more aware about some commonly used computer programs. Students learned some basic research skills using Internet browsers. Students learned how to select and modify search words to help them find information. I wanted students to try making line graphs using Microsoft Excel. Once they collected their city’s temperatures for a two week period, students entered the information on spreadsheets. I created an instructional, step-by-step handout to help the students convert their temperatures into double line graphs that showed high and low temperatures for a two week period. I modeled the instruction with my own city. The students watched and helped me create my own graph. Then they used the instructional handout to create their graphs. When students selected a place of interest within their state, they used their Internet search skills to find features and general information. They drafted what they wanted to include in their slide presentations. With this information, they constructed Microsoft Power Point presentations to persuade people to visit this place of interest. I created another instructional handout to help them with their presentations. I modeled first and asked the students to help me create my slide show using the handout. Then they created their own presentations using the handout. |
Assessment
|
Throughout the process, I conducted informal evaluations based on questions the students asked about the various computer programs. I was able to create a clear picture about which students needed small group instruction to help them with their projects. During computer lab time, I held small group workshops for students who needed help with various computer skills. After the students created the line graphs, I informally assessed students through their writing to see if they were able to analyze and interpret the weather data. The final product allowed me to assess the overall success of teaching technology within the unit. I developed a simple rubric. Below are some of the criteria I included:
- Was the student able to create a basic slide presentation, including at least three slides?
- Did the student create an interesting layout using different features (graphics, text box, etc.)
- Did the student incorporate transitions between slides?
|
Tips
for Teachers
|
I needed to incorporate a lot of modeling with the different computer programs. I regularly used a laptop connected to a projector to show students how to maneuver in programs.
I also recommend creating handouts to help students with various functions within the different programs. For example, in the handout I included information on how to save a file or how to change the size and color of text. The students were able to use the handout as a periodic reference to help them complete their projects. |
|
Student Work Samples
Click on each thumbnail to see a full-screen version.
|
|
|
|