Adapted By:
Janet Jimenez
|
Ms. Jimenez commenced her teaching career at P.S.35 in February 1998. While working with smalI groups, she worked on completing a Masters Degree with a specialization in Elementary, Bilingual Special Education allowing her to graduate with a tri-certification. She is currently teaching fourth grade.
|
P.S. 35
Bronx, NY
|
|
|
Modifications
|
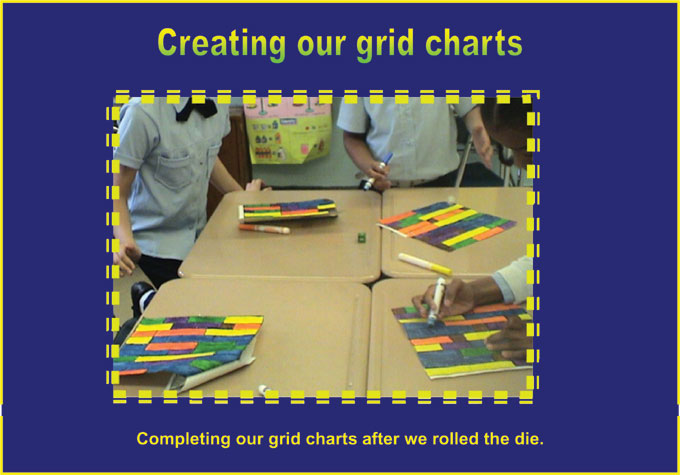
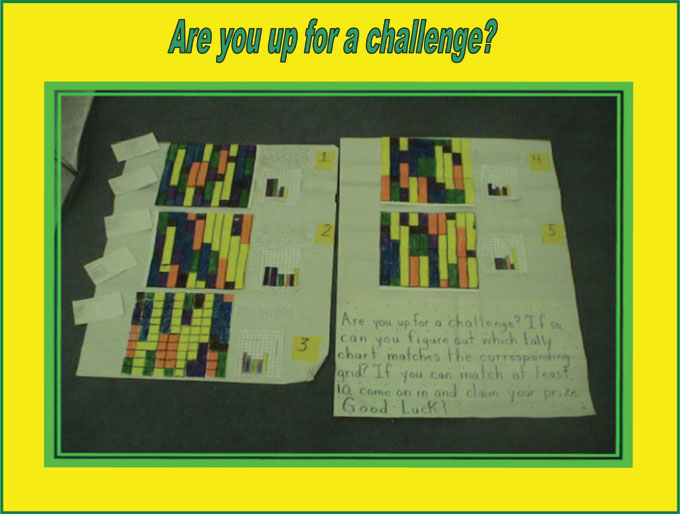
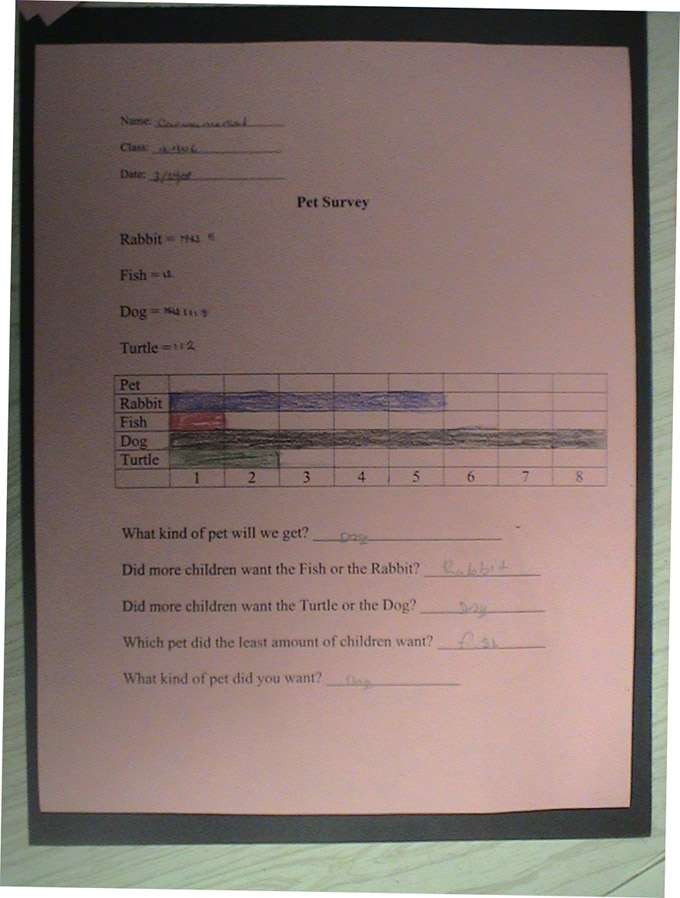
The thematic unit I selected to modify was originally an English/ Language Arts unit. Realizing that probability and chance are concepts that affect our every day lives, I decided to adapt this unit by incorporating a "mathematical approach" where students would expand their knowledge of possibilities as well as actual outcomes. Every student explored the mathematical concept of probability and chance by utilizing a 10 by 10 grid and die. Every number on the die was assigned a color 1=brown 2=purple 3=green 4=orange 5=blue 6=yellow. Students were asked to roll the die, and based on which number the die landed on, that would be the number of squares the children had to color on the 100 square grid. Students repeated the process until their grid was completely colored. Before the students conducted the experiment, they each predicted which number would result as the mode. They also estimated the number of times they would have to roll the die before they completed the 100 grid chart. As the students tossed their die, depending on which number the die landed on, they proceeded to record their outcomes on a tally chart. Once they had completed the experiment, the students proceeded to use the information on the tally chart to create a bar graph. As a result, the children were able to evaluate which number on a die numbered 1-6 had the greatest and least posssibility of coming up. Final results were then compared to their initial predictions as well as the class predictions. Students then had an opportunity to describe their experiment in a narrative account. As a culminating activity, we then randomly displayed our tally chart, along with the bar graph and grid. Anyone who could match the tally chart, to the bar graph and the grid would earn a prize. |
Instructional
Objectives
|
Students formulated meaning with words that entailed probability and chance (vocabulary words: fair, equal chance, likely, least likely, probability, expect, equally, more-less likely, possibility, results, outcome, actual, bar graphs, grid, estimate, data, mode, median, minimum, maximum).
Students organized and displayed data on a tally chart and bar graph.
Students utilized technology to analyze various uses of probability and chance.
Students compared the predicted and actual results from their experiment by writing a narrative account. |
Technology Integration
|
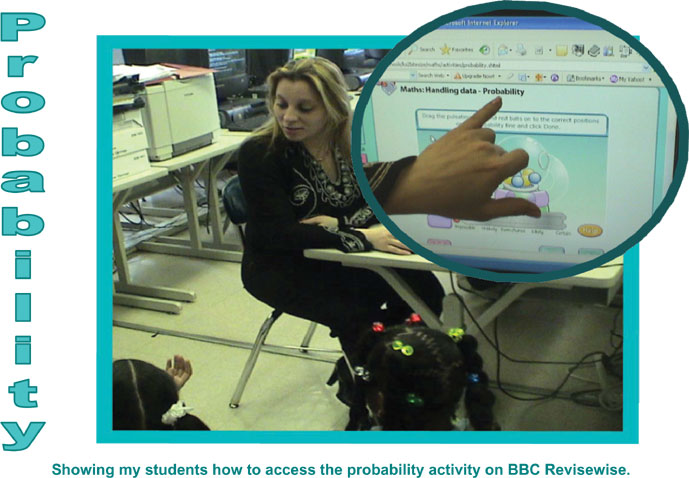
Students used Microsoft Word to type a narrative account of their experiment. In addition, students viewed an educational video, "Standard Deviants School Statistics: Probability." This video explains possible events and how to classify events. Since some of this video is too advanced for early grades, you should select the sections that are appropraite for your students. This video can be accessed via PowerMediaPlus.com if you are a member. Students also completed an interactive cross word puzzle about probability and played an interactive game of heads and tails to familiarize themselves with the concept of probability. The following web sites were used by students: Handling data – Probability http://bbc.co.uk/schools/ks2bitesize
/maths/handling_data.shtml Heads & Tails activity http://beaconlearningcenter.com/
WebLessons/HeadsIWin/default.htm |
Assessment
|
Students had to answer a series of reflective questions. Students were also able to evaluate their peers' work. Final results were then compared to their initial predictions as well as the class predictions. |
Tips
for Teachers
|
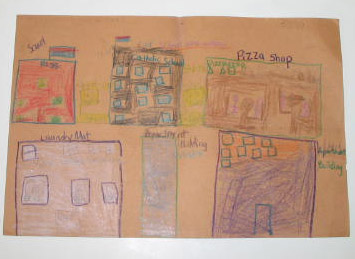
While testing the concept of probability and chance by utilizing a die, I often made students aware that probability is used in advertisements to persuade consumers. As an extension lesson, students could look at different ads that use probability and analyze the effectiveness of the data. Students will apply the knowledge gained while exploring the concept of probability towards the uses of advertisement. In addition, students will find examples of probability through everyday lives. |
|
Student Work Samples
Click on each thumbnail to see a full-screen version.
|
|
|
|
|


