 Subject:Technology, Science, Literacy Subject:Technology, Science, Literacy
Grade Level: 5th grade
Materials: Computers with Internet access and PowerPoint software, paper, pencils, chart paper, projector
About: During this webquest, students assume the role of scientists and work as part of a team that has been asked to study the causes, effects, and solutions to the Global Warming Crisis. Students' research and findings will be used to formulate a plan to aide in the crisis.
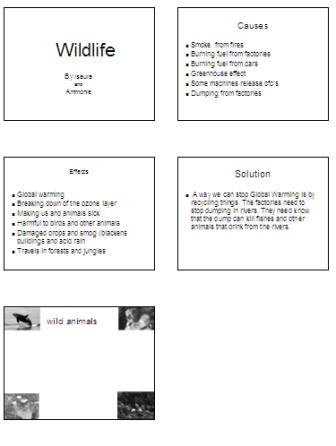
The students will generate a PowerPoint slide show on global warming and present their findings in class.
This project will reinforce students’ cooperative learning, oral, research, and PowerPoint skills.
Note: Day 2 in this lesson may extend over two days depending on the rate that the students gather their information.
http://docs.google.com/Doc?id=dd8b5mbx_37gqz9vtx6
| To reinforce students' research skills. |
| To reinforce students' oral presentation skills. |
| To reinforce students' PowerPoint skills. |
| To reinforce students' cooperative learning skills. |
|
|
|
|
|
|
| Students apply technological knowledge and skills to design, construct, use, and evaluate products and systems to satisfy human and environmental needs. |
| 5th grade |
| Technology |
| Students understand and apply scientific concepts, principles, and theories pertaining to the physical setting and living environment and recognize the historical development of ideas in science. |
|
|
|
|
|
|
|
|
|
|
|
|
|
|
|
|
|
|
|
|
|
|
|
|
|
|
|
|
|
|
|
|
|
| Day 1: What do we know about Global Warming? |
| To introduce students to the topic of global warming. |
| To have students working cooperatively in groups. |
|
|
|
|
| Chart paper, pencils, markers |
| Computers with Internet access, projector |
|
| URL for the Webquest: http://docs.google.com/Doc?id=dd8b5mbx_39dvpkg2hg |
|
| Teacher uses chart paper to create the KWL table and has students begin filling in the K & W parts of the chart on global warming. |
| Teacher then shows the webquest to the students and explains the scenario. |
| Students are divided into groups and begin discussing their roles. |
| Students choose their topic for the project (Effects of Global Warming on Wildlife or Energy) |
|
|
|
|
|
|
|
| Teacher observes that students are working cooperatively in discussing the topics and have chosen their topic for the project. |
|
| Day 2: Researching Global Warming |
| Students begin the webquest and research their selected topics. |
|
|
|
|
|
| Computers with Internet access |
| Paper, pencils |
| URL for the Webquest: http://docs.google.com/Doc?id=dd8b5mbx_39dvpkg2hg |
|
|
| Teacher reviews the Webquest project with students. |
| Students separate into their groups and research their project. |
|
|
|
|
|
|
|
|
|
| Teacher observes that students are working cooperatively in discussing the topics and researching their topic. |
|
| Day 3: Using PowerPoint to create the Global Warming presentations. |
| Students will learn the basics of PowerPoint to create their presentations. |
|
|
|
|
|
| Computers with PowerPoint installed and Internet access, projector |
| Research notes, pencils, paper |
| PowerPoint chart on inserting a slide and applying a design/transition |
| PowerPoint charts: How to insert a slide in PowerPoint, How to apply a design and transition in PowerPoint. |
|
| Teacher opens PowerPoint. |
| Teacher shows students how to insert a slide in PowerPoint. |
| Teacher shows students how to apply a design and transition in PowerPoint. |
| Students begin their PowerPoint slide presentations. |
|
|
|
|
|
|
|
| Teacher observes that students are creating their PowerPoint presentations using their research notes. |
|
| Day 4: Presenting our findings on Global Warming. |
| Students give their PowerPoint presentations on global warming. |
|
|
|
|
|
| Computers with PowerPoint software and Internet access |
| Projector |
| Rubrics: PowerPoint Rubric, Oral Presentation Rubric |
|
|
| Students present their PowerPoint slide shows to the rest of the class. |
| The class asks questions and provides feedback to presenters. |
|
|
|
|
|
|
|
|
|
| The teacher assesses presentations using the PowerPoint rubric, and assesses oral presentations using the Oral Presentation rubric. |
|
| Day 5: Revisiting the KWL Chart. |
| To have students revisit the KWL chart and write what they learned about global warming. |
|
|
|
|
|
| KWL chart, marker, paper, pencils |
|
|
|
|
| Teacher displays the KWL chart. |
| Ask the students to fill out the "L" of the chart by writing what they have learned. |
| Students then work independently to write reflections on the project. What did they learn? What did they like and why? What didn't they like and why? |
|
|
|
|
|
|
|
|
| Teacher observes that students are participating in the activity. |
|
|
Annette Lopez
alopez6@schools.nyc.gov
PS 306
40 West Tremont Ave.
Bronx, NY 10453
Annette Lopez is the Technology Teacher at PS 306. She began teaching through the NYC Teaching Fellows Program after having worked in the computer field for 12 years. At PS 306 she teaches computers to students in grades 1-5. She has developed a technology curriculum that is project-based and integrates literacy, science, and social studies. She is the point person for all technology professional development for teachers at PS 306, making sure they use technology effectively in the classroom.
Important documents for this lesson plan.
|


