 Subject: MATHEMATICS- ALGEBRA,STATISTICS Subject: MATHEMATICS- ALGEBRA,STATISTICS
Grade Level: 9 & 10
Materials:
About: This is basically an application of solving one-step and two-step equations. Students model equations, find a weekly saving amount, and prepare a weekly budget. They decide to purchase an item by visiting websites of different stores and then draw a pie chart and column chart both manually and using a computer. The students check and balance the weekly budget in order to reach their goal.
The student prepares a weekly budget, draws graphs and pie charts, and decides how much to save per week in order to reach a goal.
Students research information and prepare, check, and balance a weeky budget in order to reach a saving goal. They draw the graphs of column charts and pie charts manually and on the computer.
The teacher can use the computer lab for two different activties, and can create interest among the students by working with them using calculators and geometrical instruments like protractors, rulers, and compasses. This is a good hands-on activity.
| Solving one-step and two-step equations |
| Drawing the column chart and pie chart manually |
| Drawing the column chart and pie chart using computers |
| Preparation of weekly budget |
| Doing research on online for purchasing items |
| Using calculators and geometrical instruments |
| Modeling the equations for the daily problems |
|
|
|
| Students use multiple representations to represent and explain problem situations (e.g., verbally, numerically, algebraically, and graphically). |
| 9 |
| Algebra |
| Students choose an effective approach to solve a problem from a variety of strategies (numeric, graphic, and algebraic). |
| 9 |
| Algebra |
| Students use a variety of strategies to extend solution methods to other problems. |
| 9 |
| Algebra |
| Students understand the corresponding procedures for similar problems or mathematical concepts. |
| 9 |
| Algebra |
| Students use physical objects, diagrams, charts, tables, graphs, symbols, equations, or objects created using technology as representations of mathematical concepts. |
| 9 |
| Statistics |
| Students translate verbal sentences into mathematical equations or inequalities. |
| 9 |
| Algebra |
| Students write algebraic equations or inequalities that represent a situation. |
| 9 |
| Algebra |
| Students analyze and solve verbal problems that require solving a linear equation or linear inequality in one variable. |
| 9 |
| Algebra |
| Students solve all types of linear equations. |
| 9 |
| Algebra |
| Students recognize and apply mathematics to real-life situations. |
| 10 |
| Geometry |
|
|
|
|
|
|
|
| Day 1: PROJECT-CHECKS AND BALANCES TOPIC: FIND OUT BY RESEARCHING |
| The student gathers prices of different items in a particular store. |
| The student gathers prices of the same item in different stores. |
| The student compares the prices of the same item in different stores. |
| The student understands the special features of a particular item and decides to purchase it as a goal. |
|
|
| Computers with Internet facility |
| LCD projector or vision program in the computer lab for demonstration |
| A work sheet to note the prices of different items from different stores |
|
|
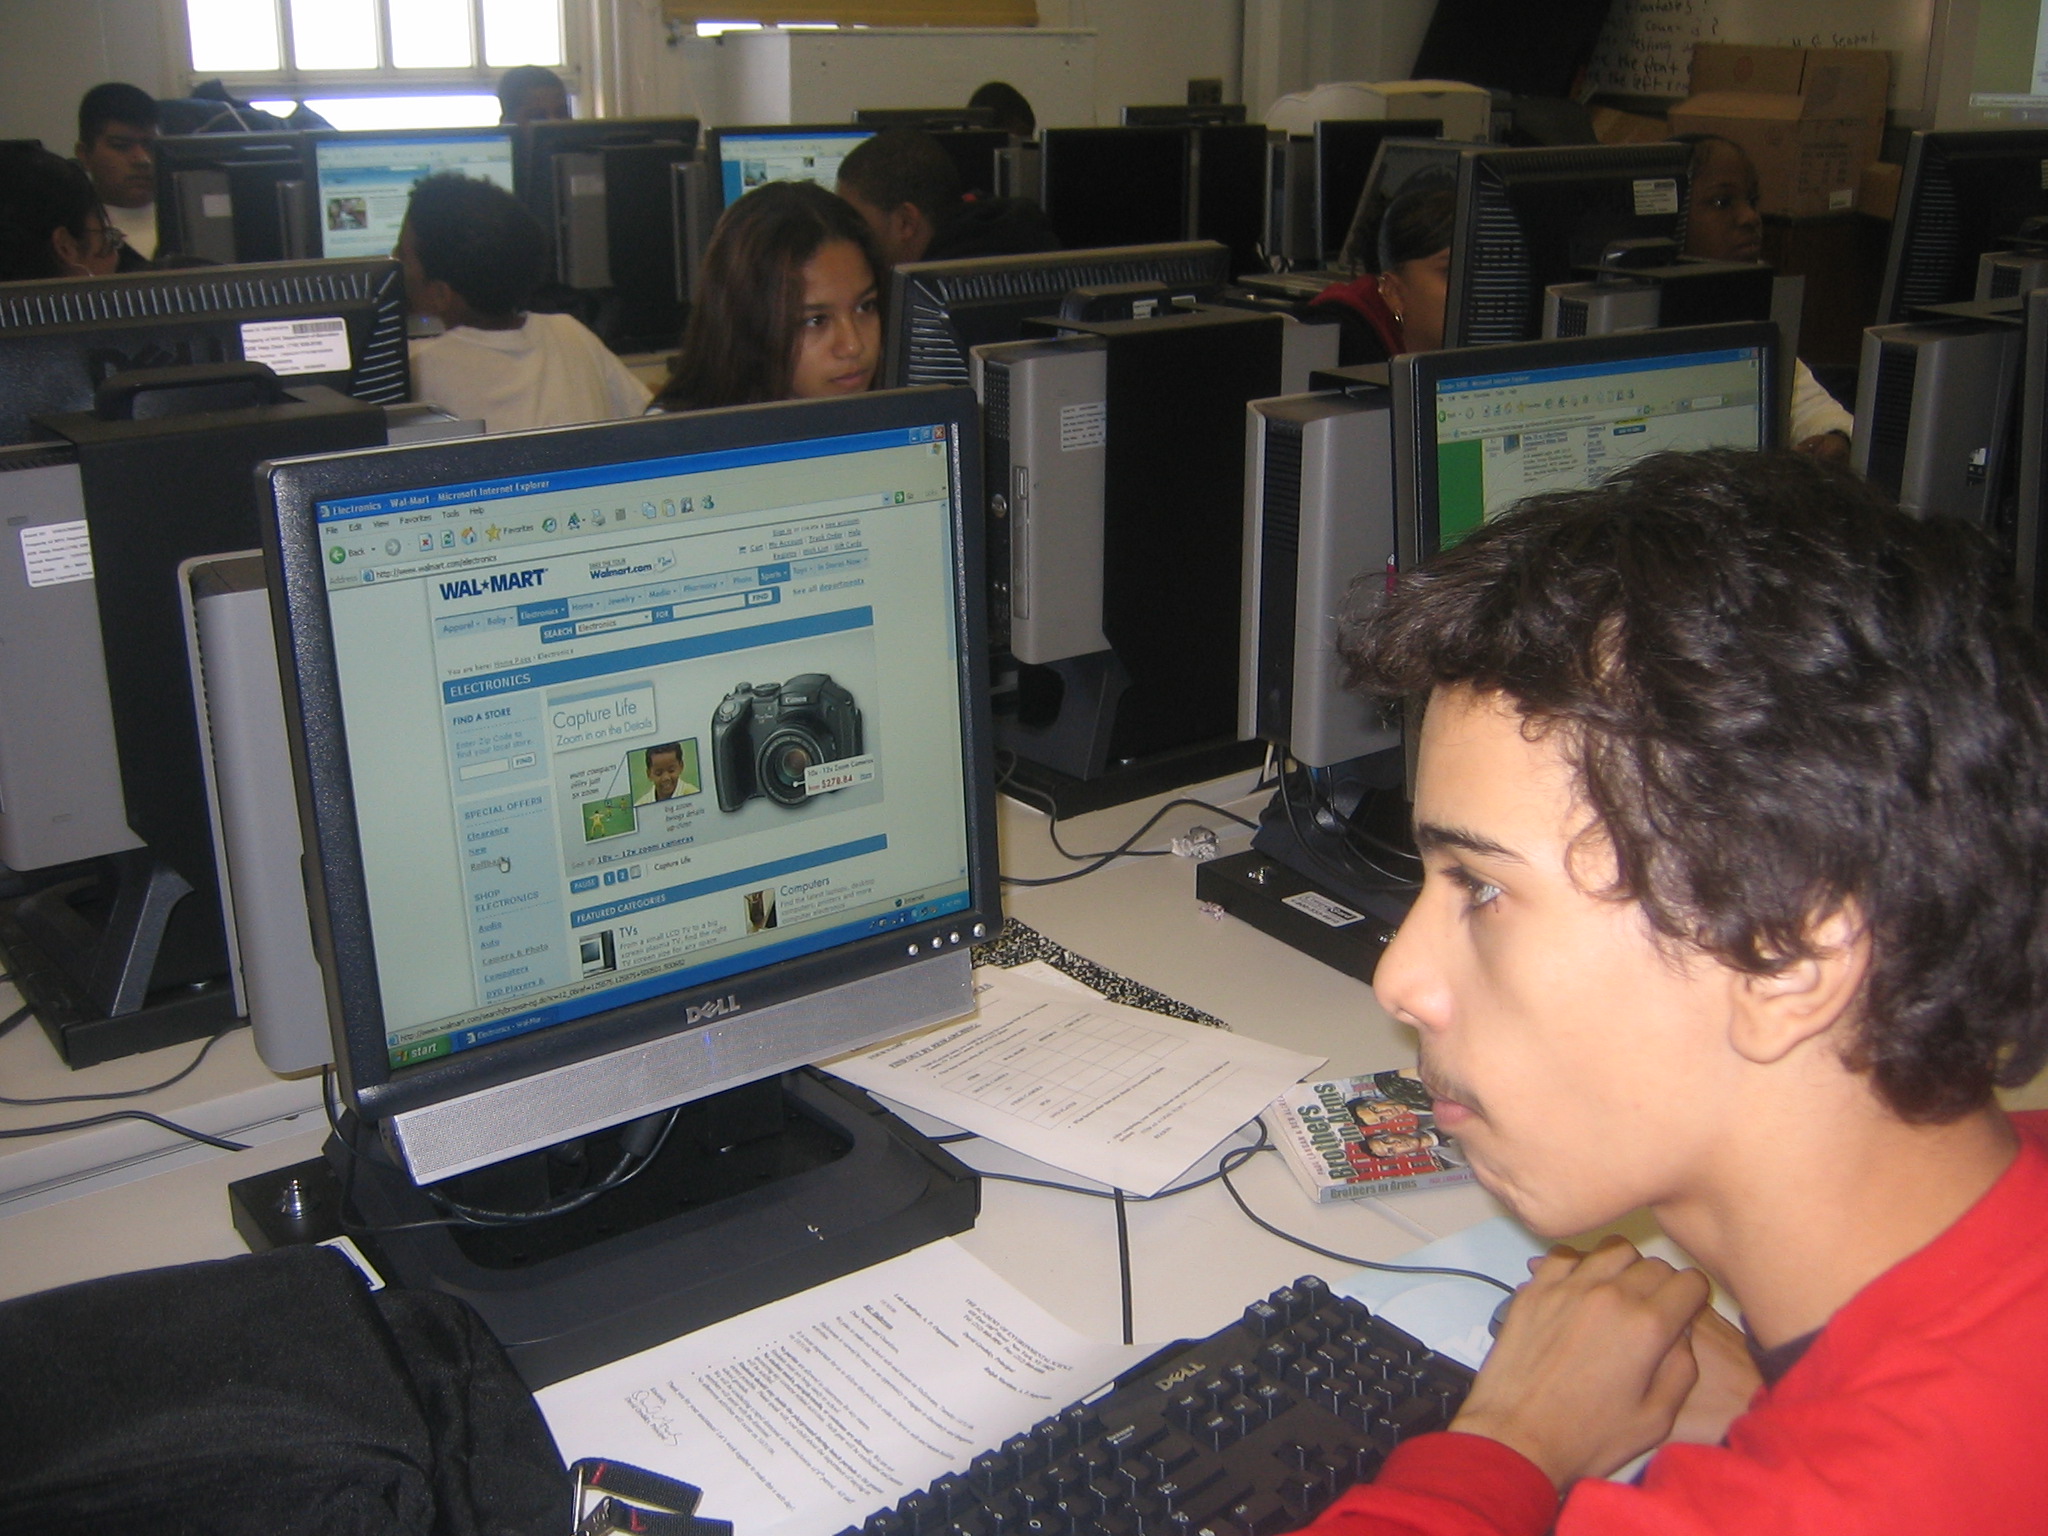
| The teacher demonstrates how to visit the website of a particular store and gather information. |
| The students visit websites and gather the required information on work sheets. |
| The students compare prices and special features of the same item from different stores and decide which item they are going to purchase. |
|
|
|
|
|
|
|
|
| At the end of the day 1, students choose an item to buy and show the reasons they have chosen that particular item. |
|
| Day 2: PROJECT-CHECKS AND BALANCES TOPIC: FIND OUT BY MODELING |
| Students model an equation for a given situation. |
| Students model an equation for an item and solve it. |
| Students recognize the amount needed to reach a saving goal. |
|
|
|
| Chart for the display and explanation of the terms of the equation of a model problem given in the work sheet |
| Overhead projector to show the process of solving an equation |
| Work sheet for solving one-step and two-step equations |
| Work sheet for the student's model equation |
|
| Explanation of the equation : 40 + 16x = 129 (as in the work sheet) |
| Students model their equations. |
| Students solve the modeled equation. |
| Students understand and decide the amount to save per week to reach a saving goal. |
|
|
|
|
|
|
|
| Solve the following one-step and two-step equations: 1) 4x = 80 2) 5x = 53 3) 2x + 30 = 50 4) 6x + 7 = 48 |
|
| The student is able to model the equation for a chosen item and find out the weekly saving amount. |
|
| Day 3: PROJECT-CHECKS AND BALANCES TOPIC: FIND OUT BY ORGANIZATION |
| Students recognize the amount of weekly savings by organizing cost price and the number of weeks to save. |
| Students understand the actual amount to save per week by organizing the weekly budget. |
| Students check and balance the weekly budget to reach a saving goal. |
|
|
|
| Work sheet/s |
| Calculators |
| Charts for display of the organized steps |
|
|
| The teacher gives the work done by students on day 1 and day 2, and provides the work sheet for day 3. The teacher explains the various steps involved to organize the data. |
| The students organize the data by observing their own work on the day 1 and day 2 work sheets. |
| The students understand whether the have reached their saving goals. |
| The students learns that in order to save more, one has to cut off excess expenditure or raise income. |
|
|
|
|
|
|
|
| The students learn that in order to save more, one has to cut off excess expenditure or raise income. |
|
| Day 4: PROJECT-CHECKS AND BALANCES TOPIC: FIND OUT BY GRAPHING ( MANUALLY) |
| The students calculate the percentage of amount spent on each item over the total weekly income. |
| The students calculate the angle in degrees for each item of a weekly budget. |
| The students draw the graph - bar chart for a weekly budget. |
| The students draw the graph - pie chart for a weekly budget. |
|
|
| Calculators |
| OHP with transparencies |
| Compasses and protractors |
| Work sheets for day 4 |
|
| The teacher demonstrates how to calculate the percentages for the amount of each item over the total weekly income. |
| The teacher demonstrates how to calculate the angles in degrees for the amount of each item over the total weekly income. |
| The teacher demonstrates how to draw the bar chart for the weekly budget. |
| The teacher demonstrates how to draw the pie chart for the weekly budget. |
| The students calculate the percentages and angles in degrees for the amount of each item over the toal weekly income. |
| The students draw the bar chart and pie chart for the weekly budget using geometrical instruments. |
|
|
|
|
|
| Collect the data of a number of students in each class of one of your teachers and draw the bar chart and pie chart for the collected data manually. |
|
| The graphic representation of the data makes it easior to access and understand. The teacher understands the students ability and skill drawing graphs manually. |
|
| Day 5: PROJECT-CHECKS AND BALANCES TOPIC: FIND OUT BY GRAPHING ( ON COMPUTER) |
| The students draw the graph - bar chart for the weekly budget using Excel. |
| The students draw the graph - pie chart for the weekly budget using Excel. |
|
|
|
|
| Computers with Microsoft Excel program |
| LCD projctor setup or vision program in the computer lab |
|
|
|
| The teacher demonstrates how to draw the bar chart for the weekly budget using Excel. |
| The teacher demonstrates how to draw the pie chart for the weekly budget using Excel. |
| The students draws the bar chart for the weekly budget using Excel. |
| The students draw the pie chart for the weekly budget using Excel. |
|
|
|
|
|
|
|
| Collect the data of students in each class of one of your teachers and draw the bar chart and pie chart for the collected data on computers. |
|
| The graphic representation of data makes it easier to access and understand. The teacher understands the students ability and skill of drawing graphs on computer. |
|
|

CHANDRASEKHAR ANUMAPURAM
CAnumapuram@schools.nyc.gov
ACADEMY OF ENVIRONMENTAL SCIENCE
410 East 100th Street
NEW YORK, NY 10029
Chandrasekhar Anumapuram has been teaching for 20 years. He currently teaches Math A and Math Projects at Academy of Environmental Science High School in New York City. His top priority is effectively using the computer and technology in teaching mathematics. His goal is to show students that mathematics is everywhere in daily life and that everyday problems can be solved with simple math concepts and formulas.
Important documents for this lesson plan.
|


