Subject:Mathematics (Algebra/Statistics)
Grade Level: 8-11
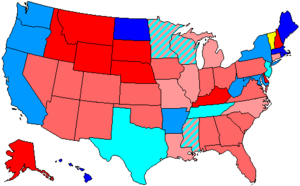
Description: This unit teaches students about the basics of statistics using data from student opinions on everyday topics. These lessons are framed as practice for learning the math skills the students will need to predict the winner of the next U.S. presidential election. These predictions are based on students' use of measurements of central tendency and box-and-whisker plots to analyze surveyed responses about opinions on major election issues.
How it Works: Days 1-2: Intro to Election Project. This portion of the unit provides a context for the study of measurements of central tendency, dispersion, and their graphic representation. It is connected to real life and therefore frames the usefulness of the math that students are about to learn. This piece may be done in conjunction with another discipline (e.g., social studies) as an interdisciplinary project, in advisory, or in the Math class.
Days 3-7 focus on math skills and are not strictly dependent on the context of the elections. If completing the election project is not feasible for you, these days address Standards 1-3, but not 4 (see below), which appears most clearly in the election project.
Days 8+: Completing the election project and/or other assessments. All materials (packets) for these are included, as well as an overview of tips in facilitating completion of the project, although detailed daily lesson plans are not. The amount of time and guidance to be given to your students for this process will depend on their level of language and familiarity with such project.
Final Project/Product: Create a book of “U.S. Presidential Election-2008” data, analysis, predictions, and conclusions and/or a learning log.
Overall Value: This project addresses key NYS Mathematics standard, provides a connection to real-life issue, and offers opportunities to critique usefulness of Math in real life (see its advantages and limitations) and nterdisciplinary work (Social Studies, English, Science).
English Language Learners: In addition to points addressed in “Overall Value” and “Tips for the Teacher “, there is a built-in focus on vocabulary, visuals, and on modeling vs. explaining that teachers unfamiliar with teaching ELLs sometimes overlook.
Tips for the Teacher: Leave pictures, labels, and flip charts with essential questions and key vocabulary around the room throughout the unit. Constantly point to them in conversations with students (one on one or large group). Slowly, kindly, push students to use this vocabulary (Example: One campaign issue is “sick people”…that is completely correct. What is another way to say that in English? Look on this chart (point)…repeat after me)
Be very attentive to organization, particularly in the surveying, field trip, and data compilation phases of the project. Be sure every adult involved clearly know his or her role and that students do not throw out any data collection surveys or compilation pages (even if they think they don't need them anymore!) until the end of the project. Best way to ensure this: provide systems for students to store information (folders, file cabinets, etc.).
|
| Students categorize data as qualitative or quantitative. |
| Grade: High School Subject: Integrated Algebra/Statistics |
| Students compare and contrast the appropriateness of different measures of central tendency for a given data set. |
| Grade: High School Subject: Integrated Algebra/Statistics |
| Students construct a histogram, cumulative frequency histogram, and box-and-whisker plot, given a set of data. |
| Grade: High School Subject: Integrated Algebra/Statistics |
| Students identify and describe sources of bias and its effect, drawing conclusions from data. |
| Grade: High School Subject: Integrated Algebra/Statistics |
| Student understand how the five statistical summary (minimum, maximum, and the three quartiles) is used to construct a box-and-whisker plot). |
| Grade: High School Subject: Integrated Algebra/Statistics |
| Students analyze and interpret a frequency distribution table or histogram, a cumulative frequency distribution table or histogram, or a box-and-whisker plot. |
| Grade: High School Subject: Integrated Algebra/Statistics |
| Day 1: Introduction to Election Project: Who will win in 2008? |
| Objectives |
| Students will know the goal of the Election Project (to use mathematics to predict the outcome of the 2008 U.S. presidential election). |
| Students will be able to express themselves in English with accurate information about: a) the date of the election, b) the names of the two major candidates & their political parties, and c) the major issues in the campaign. |
| Students will be able to express their ideas about how voters choose whom to vote for. |
| Students will make predictions about what different groups' opinions are on various election issues. |
|
| Materials |
| Election Intro Packet (attached) -- copies for students, overhead, and transparencies |
| The Big Picture” Flip chart (attached) |
| Election Issues” Flip chart. List of issues is not included as it will change based on the election in question. |
| One set of “Election Issue Pictures” for each class. Picture sets should include 3-4 pictures related each issue you have pre-chosen (ex: health care, gay rights, gun control, immigration, etc.). Pictures are not attached as they will change based on the election in question. |
| Keywords |
| candidate, political party, campaign, issue, major, predict, support, oppose |
| Procedure 1 |
| Introduce project. |
| a. DO NOW: What do you know about the election that is going to take place in November in the U.S.? |
| b. Have students write silently. Ideally, students will be able to pull on prior knowledge from news sources or current events in a Social Studies class. Speak with Social Studies teachers about collaborating on this project. |
| c. Distribute packet and have student read the title of the packet and the goal of the project aloud (Election Intro Packet p.1). |
| d. Point out the goal on 'The Big Picture' poster (poster should be already hung and folded up so only the title & the 'goal' shows. |
| |
| Procedure 2 |
| Establish base knowledge & vocabulary around the election. |
| a. Read the directions to “The Basics” (Election Intro Packet p.1) with the students. Allow students 5-10 minutes for students to complete in groups. |
| b. Circulate, helping students with vocabulary & pointing out Vocabulary section at top of p.2 to students who finish faster so that they may begin it. |
| c. Discuss answers to “The Basics” as a class. Write answers on an overhead as class comes to consensus. Acknowledge that the “campaign issues” question is hard. |
| d. Expect that students don't know the issues and/or don't know the words for them in English. Announce that you will do an activity to help understand what the issues are, since this will be a major part of the project. |
| |
| Procedure 3 |
| PICTURE ACTIVITY. |
| a. Give one stack of “Election Issue Pictures” to each group. Instruct them to put them in groups that “go together” and then to name the groups. Model one example of pictures that “go together” (example.... picture of sick man & picture of hospital) and elicit a name of the group from students (example…sick, disease, health). |
| b. After 10 minutes, have each group display one of their picture groups on the board and write the name they came up with above it. (Be sure to get representation of different issues). |
| c. Acknowledge that there are different ways to categorize pictures, and that as long as students can give a reason for categories, they are correct. Also acknowledge that YOUR idea was to have pictures representing different major campaign issues. Write the terms that you want the students to use for each issue above its group of pictures next to what the students named the group, and record the election issues on the overhead, p1, in the box about election issues. Hang a flip chart with the list of “Election Issues” you have pre-chosen and have students repeat the words for pronunciation. Continue to push them to use this terminology throughout the project. |
| d. Model filling in the word “Candidate” in the vocabulary chart on p.2. Instruct students to finish the chart in their groups and answer the question under “Your Ideas” (p.2.). Read that question aloud, and give students 15 minutes to complete p.2 Discuss p.2 as a class, using the overhead model spelling/note taking. NOTE: The ideas of similar opinions and representation are key ideas to try elicit from “Your ideas: How do people decide who to vote for?”--representation. Try to push students past “people vote for the one they like.” Sample eliciting questions: What makes you like a certain candidate? (They think like you do.) What would you want your candidate to do if he or she were president? (The same thing that you would do as president--representation.) |
| |
| Procedure 4 |
| Predicting the opinions of American voters |
| a. Read the instructions aloud at the top of p.3. Ask students what 'predict,' 'support,' and 'oppose' mean. |
| b. Model annotating on the overhead (write their paraphrasing next to the typed word). |
| c. Read the Issues aloud and instruct students to fill in whichever additional issue they would like in the final column. Model filling in predictions for “males” on the overhead. Tell students to keep their ideas secret and give them “cover sheets” to hide them from neighbors. |
| d. Allow students 10 minutes to complete. Circulate, helping with vocabulary. Option: Have pictures representing different demographic groups ready to help beginning ELLs understand vocabulary. |
| |
| Procedure 5 |
| Review and assign homework. |
| a. Read instructions at bottom of p.3 together. |
| b. Assign each student ONE issue. |
| c. Model only filling out ONE answer with the students. |
| d. Discuss options for where they can get their information. Tell them it will be their job to teach their classmates what they learned . |
| |
| Extension |
| See Procedure 4. In addition, extra credit/challenge: bring in a source of information about election issues, summarized in your own words. |
| Assessment |
| Informal assessment. Participation in activities. Their understanding (or not) of objectives will become clear over the following lessons. EXAMPLE: Tomorrow's lesson begins with some comprehension checks Interdisciplinary overlap : This lesson could be done in a social studies classroom or supported and or adjusted based on work in the students' social studies class. |
|
| Day 2: How can we measure and talk about the opinions of different groups? |
| Objectives |
| Students will be able to express themselves in English with accurate information about: a) the date of the election, b) the names of the two major candidates & their political parties, and c) the major issues in the campaign. |
| Students will be able to express the opinions of the major presidential candidates on the major campaign issues. |
| Students will demonstrate an understanding of what a demographic group is by giving examples. |
| Students will be able to express an understanding and examples of the following ideas: degree, representation, sample, (possibly stereotype). |
|
| Materials |
| Election Intro Packet (copies for students, transparencies, overhead) |
| “The Big Picture” Flip chart--attached |
| “Election Issues” Flip chart |
| Statistics Practice Packet (copies for students, transparencies, overhead) |
| Keywords |
| degree, sample, representative, stereotype |
| Procedure 1 |
| DO NOW: Find out what the major presidential candidates think. You have 5 minutes to fill in the chart at the bottom of p.3 by interviewing your classmates. Read Do Now together. |
| a. Allow students to circulate. Come to consensus as to whether the two major candidates support or oppose given issues. Discuss any problems that arose in students' investigation for homework |
| b. Vocabulary: Demographic groups. Read question at top of p.4 aloud, and have students repeat the word 'demographic' for pronunciation. Model giving examples of “gender” and allow students to complete the rest of the chart on their own. |
| c. Discuss responses (use overhead for spelling modeling). |
| d. Discuss question at bottom of p.4 together .(Response to elicit: People's opinions might be different if they are in different groups. People from different groups may vote differently.) |
| |
| Procedure 2 |
| Work through “Steps to Prepare” on p.5 of Election Intro Packet. Read aloud & do quick comp checks with students. |
| a. Reference “Election Issues” Flip chart & ask students to vote on their top 3 issues. Acknowledge that it would be more interesting to look at all of them, but that for time and energy sake, we will focus on 3 as a class. Assign ONE of the groups to each pair. Do for Demographic groups as you did for “Election Issues.” |
| b. Comprehension check on what 'predict' means. Give students 3 minutes to fill in their prediction about their group and issue. Ask for 2 or 3 students to share. |
| c. Read through questions 6 and 7 as a class. Do a quick model of survey (ask 3 or 4 students if they oppose or support a given issue & record their answers on the edge of the board). |
| d. Use #7 to transition to next procedure. |
| |
| Procedure 3 |
| Introduce Essential Question of Stats unit and its connection to the project. Distribute Statistics Practice Packet and read question at top together. Ask three students to share one group they made a prediction about and what that prediction was. (Ex: I think women support keeping abortion legal.) |
| a. Allow a bit of discussion about whether these three predictions are true. Cut off what should be energetic participation and tell students to circle YES or NO--the predictions are true. Do the same for if they are false. |
| b. Class discussion about question 3 on p.1 (To elicit: We don't know what these groups REALLY think. Everyone in the group doesn't always agree. Perhaps spend a couple of minutes talking about the word stereotype--see Interdisciplinary connections). |
| c. See if the students have any answers to question 4 p.1. Either way, acknowledge that this is what we are trying to figure out how to do with this unit |
| d. Share essential question (from “The Big Picture” flip chart). Try to get students to say what the connection of this question is to the election project, then share what you have written on “The Big Picture” flip chart. Do some comprehension checks with a few students in their own words as all students copy this onto bottom of p.1 of the packet. Continue to refer back to “The Big Picture” throughout the unit. |
| |
| Procedure 4 |
| Reviewing the idea of percentage & thinking about sampling (p.2 Statistics Practice Packet). |
| a. Read Part 1 given. Allow students 3 minutes to write responses & share. Note in the box as a class (on overhead): Mathematically, 150 < 200, so it is natural to quickly answer that girls like dancing more than boys. |
| b. Read Part 2 given. Allow students 3 minutes to write in responses. Share: What has changed now? Same answers, but we have more information -- not JUST about the answers we got, but also about who we asked: Mathematically, 150/ 150 boys = 100% and 200/400 girls= 50%. Elicit different ways of explaining what % means. Note that now we might say more boys like dancing than girls. |
| c. Give students some vocabulary guidance. Ask them to fill in with you…SAMPLE: Who you ask, and how many people. If you want to know if girls like dancing, is it better to ask 10 or 100? REPRESENTATIVE: How many is enough? Does it matter which girls you ask? (Get examples: What might change the answer---If you ask all Latino girls? All teenage girls?) DEGREE: Even if you ask 1,000,000 women of all colors, shapes, sizes, ages, etc…will you know that YES they like dancing or NO they don't? Sometimes the answer is not just YES or NO… it is somewhere in the middle. |
|
| |
| Procedure 5 |
| Learning vocabulary about degree (p.3…Statistics Practice Packet). |
| a. Are you hungry? Ask students to mark an X on the line showing HOW hungry they are. Write down four sample sentences with vocabulary talking about degree. (Ex: 1. I am very hungry. 2. I'm somewhat hungry. 3. I'm a little bit hungry. 4. I'm not very hungry. 5. I'm not hungry at all. ) Take the key words (very, somewhat, a little bit, not very, not at all) and but them on the “hunger line” with students. This technique will be helpful in teaching probability as well. |
| b. Give students 15 minutes to finish p.3. Circulate to help with vocabulary & spelling. Ask students to read/model pronunciation as you are circulating. Ask students to share their answers to the last question & to share the two questions they wrote. |
| c. Why do we care about the opinions of different groups? (p.4 Statistics Practice packet) |
| d. Read introduction and fill in the first row together. Instruct students to finish page for homework |
| |
| Extension |
| See Procedure 7 above |
| Assessment |
| Informally, Through comprehension checks at the beginning of the lesson (checking yesterday's lesson) & through their responses to p.3 & 4 (today's lesson) Interdisciplinary overlap--Is the idea of overlap coming up in English or Social Studies classes. There is room for collaboration or integration of cross-discipline examples here. |
|
| Day 3: Measurements of Central Tendency: The Basics of Quantitative Data |
| Objectives |
| Students will be able to calculate mode, mean, and median for the simplest case quantitative data set. |
| Students will be able to explain how to calculate mode, mean, and median. |
| Students will be able to identify a data set as qualitative or quantitative. |
| Students will be able to explain the difference between qualitative and quantitative data. |
|
| Materials |
| “The Big Picture” Flip chart--attached |
| “Election Issues” Flip chart |
| Statistics Practice Packet (copies for students)--attached |
| Statistics Practice packet (1 copy on transparencies) and overhead |
| Keywords |
| qualitative, quantitative, mean, median, mode, central, tendency |
| Procedure 1 |
| DO NOW: Write down anything you know about the words MEAN, MEDIAN, and MODE. |
| a. Give examples and/or explain. Tell students if you've never seen these words before, write about that. |
| b. Give students time to write, and circulate to see their level of prior knowledge. |
| c. Tell students that we will come back to Mean, Median, Mode later in the lesson. |
|
| |
| Procedure 2 |
| Review homework: Why do we care about groups' opinions? (p.4 Statistics Practice Packet) |
| a. Choose two you think are most important, and ask students to share their ideas about the percentage, what it means, and who would want to know. OR ask students if there are any in particular they would like to discuss (not necessary to review all). |
| b. Discuss: Is 65% of Americans supporting gay marriage a lot or a little? Provide arguments for your opinion. (Idea to elicit through examples--same percent could be a lot or a little depending on who wants to know & why.) |
|
|
| |
| Procedure 3 |
| Quantitative Data: How to best represent it? (pp 5-6) |
| a. Remind students of essential question (“The Big Picture Flip Chart”). Explain that we will now be using some everyday examples that are NOT related to the election to help us learn the math that we will use make our election predictions (refer to “Connection to Election Project” on the “Big Picture Flip Chart”). |
| b. Ask students to turn to p.5 and consider the question “How many hours of TV do you watch in a week? Give them a few minutes to think, then go around the room and record every student's response on the overhead. Have students record as well. NOTE: Watch as you go--add your own answer if you need to make sure that there are an odd number of responses (so the median will be simple) and/or if you need to make sure there is only one mode. This first example should be simple. |
| c. Elicit what data means (p.5). Ask if anyone knows what qualitative or quantitative means, but DO NOT let them respond out loud. Instruct those who know to write down the answer. Ask the others to look at the roots of the words (underlined on p.5). Try to get them to see “QUANTIT” as 'quantity'. Perhaps ask if this word sounds like anything in their first language, or send students to use the dictionary to look up the words. |
| d. End with class together, defining QUANTITATIVE as having to do with numbers and QUALITATIVE as non-numerical, but based on descriptors or words. Model annotating these notes next to words QUALITATIVE and QUANTITATIVE on p.5, in addition to writing down the answer to the question. |
| |
| Procedure 4 |
| Give students 2 minutes to answer the question “If your mother asks you, 'How much TV do your classmates watch?', what would you answer?” |
| a. Ask students to share answers, and discuss who gave the best answer, why, and if this question bothers anybody. The idea of not being able to “pick just one” number should come up. Use this conversation to generate a class definition for representative. |
| b. Ask students to write down what they understood of the conversation in the last box. (Possible ideas: How can we have just 1 number as an answer when everybody watches different amounts of TV? If we say 20 hours, what about the people who only watch 2 or 29? But if we don't agree on what answer to give, what can we do? If your mother asks, “How much TV do your classmates watch?” you're not going to give her a whole list of data! People don't do this. But if the answer you give isn't representative, some classmates might disagree. Or you might develop a stereotype.) |
| c. Read the two sentences in the middle of page 5 together. Circle them, star them, draw attention to them. |
| d. POINT OUT that this idea of choosing ONE answer to the questions about “how much TV your classmates watch” is NOT an easy one. Some of them will be focusing mostly on learning how to calculate mean, median, mode. Especially for those who already may know a bit about mean, median, mode, THEIR goal for this unit is not to just show they can calculate them without reflecting. Their challenge is to figure out WHICH is most representative mean, median or mode…. |
| |
| Procedure 5 |
| Teach finding of mode, median, and mean. |
| a. Think aloud. Find the mode (p.6). List the data (4 months appears 2 times, 5 months appears 1 time, etc). Make a point of visibly & audibly counting the data. Announce that the mode is ____. Ask students to tell you what you did to find the mode & fill in the last box on p.5 together (Possible response: Count how many time each NUMBER or DATA ITEM repeats & write down the one that repeats the most. This is the mode.) |
| b. Think aloud. Find the median (p.6). Recopy the data in a line. Count one from each side until you arrive at the middle. Write down the middle number (as the median). Then shout "Oh no! Wrong!" Cross out your answers emphatically and tell yourself “I forgot the most important part! To find the median, I have to put the numbers in ORDER!” Put them “from biggest to smallest” and count from the outside in to get the median. Then put them “from smallest to biggest” and count from the outside in to get the median. Exclaim excitedly “Yes! It's right…same answer, because both ways the numbers are in order." Point and repeat. “The first one was wrong (cross it out again), but this is okay (point to ascending order) and this one is ok ay(point to descending order). I can do whichever one I want. Get the students to explain what they saw you do to find the median (Sample response: First, put the numbers in order. Then count from the outside in to find the middle. The middle number is the median. NOTE: Depending on level of students, they may want to count the 3 of data items, divide by 2, and count to the median…) |
| c. Think aloud. Find the mean (p.7). Write out each number added and visibly/orally count the number of data items and divide by it. Use a calculator. Comment about how you hate decimals, but you know you did this right. Tell yourself, wait--I think there is another way too. Use multiplication to simplify the task (Say “I see 4 five times, I see 5 two times…” as you write 4x5 +5x2….etc). Record the mean and again ask the students to explain to you what you did. (NOTE: For any of these explanations, you may want to give the students a few minutes to write their ideas in groups before calling on one to answer). Ask them if they know another word for mean and model annotating, writing the word AVERAGE next to the word mean. |
| d. Have students finish the rest of p.7, filling in the blanks. Encourage students to discuss the CHALLENGE questions and to use a dictionary if it helps. Circulate and push them to think about this--it is a challenge for now, but will become more clear in class later as we work on the election project. |
| |
| Extension |
| Challenge described in Procedure 4D. Provide extra credit. Offer students the opportunity to teach this idea to the class if they can figure it out. |
| Assessment |
| Informally--through their participation for now (ability to tell me what I did). |
|
| Day 4: Measurements of Central Tendency: Tricky Quantitative Data & Qualitative Data. |
| Objectives |
| Students will be able to calculate mode, mean, and median for data sets seeming to have multiple modes or medians. |
| Students will be able to explain how to calculate mode, mean, and median, and explain when it is not possible to do so. |
| Students will be able to identify a data set as qualitative or quantitative. |
| Students will be able to explain the difference between qualitative and quantitative data, and what that means for calculating measurements of central tendency. |
|
| Materials |
| “The Big Picture” Flip chart--attached |
| “Election Issues” Flip chart |
| Statistics Practice Packet (copies for students)--attached |
| Statistics Practice packet (1 copy on transparencies) and overhead |
| Procedure 1 |
| DO NOW: The following are the ages of the students in my group: 12, 15, 13, 15, 14. 1) What is the mode age of students in my group? 2) What is the median age? 3) What is the mean age? |
| a. Allow time for students to complete, circulating to help strugglers and asking some students to help others. |
| b. If students finish quickly, tell them to start page 8 as you finish helping others. |
| c. Ask three students to present their solutions (2 minutes each). |
|
| |
| Keywords |
| qualitative, quantitative, mean, median, mode, central, tendency , ascending, descending |
| Procedure 2 |
| Calculating measurements of central tendency: practice |
| a. Explain to students that they have the period to complete pages 7-10. Show them the two sets of data in question (p.7, p.9) and point out that these are answers from last year's class. (Not really--you made them up to have two data items that repeat the most, and an even number of data items, but don't tell them this.) |
| b. READ THROUGH the questions on page 7 with them. Ask if they think they can answer qualitative and quantitative questions, and if they can explain in their own words how to get mean, median & mode. They should say yes! |
| c. WARN THEM…this data is tricky on purpose! Point out that after the question “Show your work” (for the mode on p.8), they are asked “What is the problem?”… SOMETIMES THEY WILL DO EVERYTHING CORRECTLY & THEY WILL COME ACROSS A PROBLEM!. Tell them not to get frustrated. |
| d. If there is no problem, tell them to write NONE. IF there is a problem, tell them to explain the problem and then explain what THEY think they should do to fix the problem. |
| |
| Procedure 3 |
| Allow students the period to work. |
| a. You will need to circulate a lot, helping students when they get to the “problems”, encouraging them not to get frustrated and to write down their ideas. |
| b. Prod them to come up with ideas…(Ex: Do you think there can be 2 modes. Yes or no? What would you do? Write it down!), encouraging them to get others' ideas as well. |
| c. Work with struggling students on basics and discussion challenge (bottom p.8) with more advanced students. |
| d. You may need to give direction on the CONCLUSION at the bottom of p. 10 as students reach that point. Remember--it is okay right now if students are not getting the right answers… Discussion will be tomorrow. |
| |
| Extension |
| Homework: Finish pages 7-10 if you haven't. For struggling or special needs students, you may want to go around individually and adjust their data to avoid the “problems” (2 numbers that repeat the most, 2 number in the middle), to give them practice with the simplest case first (or perhaps only requiring them to do the simplest case, depending on their goals). |
| Assessment |
| Informal observation of their work on pages. 7-10 and their participation in class discussion. Interdisciplinary overlap- Instead of using data from “previous classes,” talk to science or social science teachers to see if there is data related to their class that you can use. This will make the discussion of “WHICH measurement of central tendency is most representative” more interesting & more representative. |
|
| Day 5: Measurements of Central Tendency: Tricky Qualitative Data & Quantitative Data (continued) |
| Objectives |
| Students will be able to calculate mode, mean, and median for data sets seeming to have multiple modes or medians. |
| Students will be able to explain how to calculate mode, mean and median, and to explain when it is not possible to do so. |
| Students will be able to identify a data set as qualitative or quantitative. |
| Students will be able to explain the difference between qualitative and quantitative data, and what that means for calculating measurements of central tendency. |
| Students will be able to explain the advantages and limitations of the different measurements of central tendency. |
| Materials |
| “The Big Picture” Flip chart--attached |
| “Election Issues” Flip chart |
| Statistics Practice Packet (copies for students)--attached |
| Statistics Practice packet (1 copy on transparencies) and overhead |
| Keywords |
| qualitative, quantitative, mean, median, mode, central, tendency |
| Procedure 1 |
| DO NOW: Answer the following questions with MEAN, MEDIAN, or MODE. |
| a. 1) Which one counts only the most common data item, and completely forgets about the rest? 2) Which one counts each of the data items as equally important? 3) Which one tries to find a middle ground between all the data items? |
| b. Allow students time to answer. |
| c. Discuss, using the data on pages 5-6 (How many hours do you watch TV?) as examples (Eg: For the mode, we have completely LOST all other information except the one that repeats the most. For the mean, we take each answer & it contributes to finding the mean. For the median, we are really looking at the middle in 'chronological' order.) |
|
| |
| Procedure 2 |
| Review answers from pages 7-10. |
| a. Ask: Who thought this was easy when I showed you, but then had problems doing it on their own yesterday and got frustrated? Who is happy they figured out a trick? Gauge the reaction. |
| b. Tell students today is the day to make sure everybody really gets this, and for those of you who figured it out to show off. |
|
|
| |
| Procedure 3 |
| Go through pages 7-10 question by question on the overhead. |
| a. BE CAREFUL not to bore students. Move quickly through things everyone gets. Alternate between letting students raise hands to call on them, and warning them you want to see no hands, you are just going to call on who you feel is likely to be ready! |
| b. Draw special attention to the following: When it looks like there are 2 modes, you can either say the data is BI-MODAL (2 modes) and give both or say there is NO mode (depending on which Math book you listen to) When it looks like there are 2 medians, there AREN'T. You have to add them & divide by 2 to find the real median (Elicit the vocabulary: you actually find the mean of the 2 numbers in the middle to get the median. Acknowledge that this is confusing but you know that they can keep it straight!) |
| c. You can't find the median of qualitative data because you can't put it in ORDER! COMMON MISTAKE: finding the median using the order given! Warn students not to fall into this trap. Point out that the mean is the only one that can be a decimal (if the original data wasn't)…talk about if this is a “problem” or not … IDEA: the mean isn't even IN the data set. Does a decimal make sense as the answer to the question? (nobody was in the country 35.5 months, so how can this represent everybody?) |
| d. You can't find the mean of qualitative data because you can't add and divide words--you need numbers! Take notes in the margins or in extra white spaces when you have these interesting observations--model this and give students time to do the same!
Page 9 bottom--Get their ideas about WHICH IS THE BEST, but don't get too into a conversation yet beyond what's in the challenge--not enough of them will understand until you have more appropriate examples (later, during dispersion)
Page 10 bottom--Conclusion for what you can do with qualitative and quantitative data: draw their attention to this. |
| |
| Procedure 4 |
| Discuss which measurement of central tendency is best representative of a set of data. |
| a. Read through the directions & questions on pg.11 together. |
| b. Assign one measurement of central tendency to each group . |
|
|
| |
| Procedure 5 |
| Jigsaw into groups of 3, with one member from each of the measurements of central tendency (1 student to share his or her group's idea on mode, one for the median, and one for the mean). |
| a. Share main ideas with class and come to consensus. |
| b. Point out being easy to do is just one advantage--sometimes it is worth it to calculate a more difficult measurement. |
| c. Read the conclusion at the bottom of the page together. Ask students if they can think of any examples they've seen so far that provide evidence for this statement. |
| d. Explain that we will see more examples of this in the Election Project. |
| |
| Assessment |
| Informally: By their responses to homework review and answers to page 11. |
|
| Day 6: Analyzing data using Box & Whisker Plots |
| Objectives |
| Given a set of data, students will be able to calculate the 5 numbers of a 5-number summary and identify them by name. |
| Students will be able to construct a box-and-whisker plot. |
| Students will be able to identify for which sets of data it is possible to construct a box-and-whisker plot, for which it is not possible to do so, and explain why. |
|
|
| Materials |
| “The Big Picture” Flip chart--attached |
| “Election Issues” Flip chart |
| Statistics Practice Packet (copies for students)--attached |
| Statistics Practice packet (1 copy on transparencies) and overhead |
| Keywords |
| maximum, minimum, quartile |
| Procedure 1 |
| DO NOW: Explain in your own words what you think the following words mean: a) maximum, b) minimum, c) quarter, d) range.
|
| a. If you want some information, would you rather look at a list of numbers or a graph? Why? |
| b. Share answers to vocabulary, recording them on the board for later reference. If students bring up the idea of $0.25 for a quarter, relate this to the percentage of a dollar. |
| c. Try to elicit the fraction representation. |
| d. Discuss question #2. Try to elicit the ideas of information being easier to understand VISUALLY (in picture form), but ONLY if you understand the picture! |
| |
| Procedure 2 |
| Box & Whisker Plot |
| a. Explain: This is a graph that allows us to see how the data is spread out around the median. Advantage: we get more information than just one number. |
| b. Show the students the box & whisker plot on pg. 12. Acknowledge that it looks scary, but that it actually is based on just FIVE numbers (fill in 5 together on overhead). |
| c. Go through each of the 5 numbers, pointing to them on the box & whisker plot, and filling in the chart what they are. (Ex: MINIMUM= the smallest data item, MAXIMUM=the largest data item, MEDIAN=the data item in the middle when we put them all in order.) |
| d. Take a bit more time with the 1st & 3rd quartile. Without defining them, use the place in the chart to do a think aloud and demonstrate how you calculated them. Then ask the students to explain how you got them (1st quartile is the median of the data below the true median. 3rd quartile is the median of the data above the true median). Record the class answer & allow the students to copy notes. |
| |
| Procedure 3 |
| Elicit from students WHY we use the word "quartile". |
| a. Refer back to do now, and quarter meaning 25% or ¼. |
| b. Read through top of page 13 together. Allow students the choice: to begin working on pages 13-14 on their own or to join your group at the front of the room to do page 13 together before finishing page 14 on their own. |
| c. While students are circulating, you will need to help with the frustration of trying to do a box-and-whisker for qualitative data. |
| d. Encourage students to always write out the specific problems they are encountering when they get frustrated (example: How am I supposed to find the maximum, minimum, median, etc of data like “pink, blue…” None of them are bigger or smaller, so I can’t put them in order. Not possible!) |
| |
| Extension |
| Homework: Finish pages 13-14. Possible extension: Include a few more pages on histograms or line plots, particularly to address the need to visually represent qualitative data.
|
| Assessment |
| Informally, small group work. Interdisciplinary overlap- Again, speak to other subject teacher to get data relevant to their classes, or at least to get ideas of what kind of data sets you could invent that might simultaneously support student learning in other classes. |
|
| Day 7: Election Project & Book Construction |
| Objectives |
| Students will create their own surveys. |
| Students will complete a field trip during which they survey members of a neighborhood. |
| Students will understand good survey etiquette. |
| Students will understand predictions and outcomes in statistics. |
|
| Materials |
| “The Big Picture” Flip chart |
| student survey (sample attached) |
|
|
| Keywords |
|
| Procedure 1 |
| Reintroduce the Election Project by focusing students on “The Big Picture” Flip chart. |
|
|
|
|
| |
| Procedure 2 |
| Create survey with students (see attached sample). |
| a. Be sure to number the opinions (1= strongly oppose, 2-oppose, 3-indifferent, 4-support, 5-strongly support) to facilitate quantitative data analysis.
|
| b. Type up, copy, and give each student 20 copies of the survey (created in class or attached).
|
| c. Assign them to complete 10 with people in their neighborhood. |
| d. Plan a field trip day (by advisory?). Assign each advisory to a demographically different area of the city. Each student must complete their 10 remaining surveys this day.
|
| |
| Procedure 3 |
| Prep for survey field trip day. |
| a. Brainstorm what to do and what not to do when surveying people in a t-chart flip chart (politeness, eye contact, possible phrases to use, always be with a buddy…). |
| b. Choose a student to help you model good survey etiquette and bad survey etiquette (make it humorous-- do everything you shouldn’t). You can do this before doing the brainstorm or after, depending on your kids. |
| c. In conclusion, talk with the class about why it is important to use good survey etiquette (safety, respect, being a good representative of your school. Prepare students for taking the subway (map reading skills!). |
| d. Make sure each student has a demographic group, issue, and a partner. Pairs of partners should be matched up with another pair according to demographic group and issue (e.g., the pair investigating how males feel about keeping abortion legal grouped with the pair investigating how females feel about keeping abortion legal).
|
| |
| Procedure 4 |
| Data compilation |
| a. As students are working through pages 6-11 of “Election Project Intro Packet” , give each of them a flip chart paper on which to write their data. This will make their data available to everyone for discussion & for thinking about challenge questions. (See “Election Project Guidelines and Template.) |
| b. Strong classroom management and constant conferencing will be necessary as students work through Election Project Template & Guidelines. |
| c. Be sure to go over rubric with students as they begin this part of the packet. |
|
| |
| Procedure 5 |
| Be sure to discuss Conclusions, Reflections, and Challenge pieces as a group (pages 10, 11, 12, 15) as a class. |
| a. Interesting reflection and analysis points to try to elicit:
• What surprised you most?
• Was our prediction correct? Why do you think it was or wasn’t?
• How representative was our sample?
• Is it possible any of the data was biased? Explain. |
|
|

Jesseca Long
jrlong9@yahoo.com
Bronx International High School
1110 Boston Rd
Bronx, NY 10456
Jesseca Long is a teacher of Mathematics, French, and ESL. In addition to teaching in the U.S. and Africa, she has worked as a Math coach and teacher trainer, and on facilitating professional development in the areas of Classroom Management, Collaborative Learning, and Language Development in Mathematics. She currently teaches Advanced Algebra & Pre-Calculus to 12th grade students at Bronx International High School.
Important documents for this lesson plan.
|


