Social
Studies Lessons for High School is designed for social studies teachers to use with their government and history courses. It was developed in response to a shift in education throughout our country: a move away from rote memorization and toward the critical thinking skills necessary for many of the new performance assessment programs.
Each lesson will enable teachers to teach seven specific critical thinking skills in a step-by-step process. The information has been adapted for old media and new media formats. Web sites will be provided that will allow teachers to choose the most appropriate resource for the selected activity. All selections can be copied for classroom use. Teachers may adapt activities to allow students to complete assignments via the web.
Bob
Black is former Teachers Network web mentor. He is a social studies teacher at the Harbor City Learning
Center, located across the street from the historic Edgar
Allen Poe House in Baltimore, MD.
Sample Student Template
Standard Students will analyze the roles and relationships of regions on the formation and implementation of government policy.
Model for Analysis
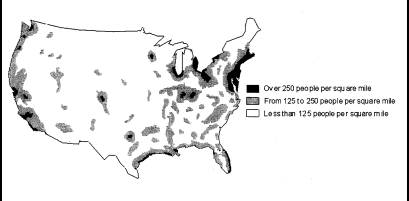
Population Distribution in the United States
Q. What type of map is this? A. A population map.
Q. What does the title mean? A. That the population is spread out throughout the U.S.
Q. Explain which map element is most important for understanding this map. Why? A. The key because it shows which areas have the most people.
Q. What conclusions can you make about the information on this map? A. Most of the population in the U.S. is located in the northeastern region of the country; few people live in the
northwest-central area; many people live along the coasts.
Q. How were you able to interpret the map? A. I read the title and key, then I studied the map to figure out where most people lived.