|
Using Excel to Help You Organize Student Data
Vanessa Thrash
As educators, we exist in a data driven environment where student assessment is key to measuring student performance. How can you as a classroom teacher use technology to help you organize your student information that is relevant in helping you drive your instruction? Microsoft Excel is a spreadsheet that can help you record, sort, calculate and display information. You can record test scores, averages, attendance, class projects, etc. This information can be displayed on report cards, progress reports, form letters to parents, graphs, and other formats. In New York, student performance is also displayed in level scores of 1, 2, 3, and 4. Your question might be, “If my student information is in percentage, how can I convert it to levels? Use Microsoft Excel. (There are many spreadsheets out there but today’s standard is Microsoft Excel.)
As a practical application we are going to use Excel to create a gradebook to hold student data. A gradebook is a key method of accountability for students, teachers, parents as well as administrators. School communities throughout the United States demonstrate the necessity for gradebooks by giving a paper one to each teacher at the beginning of the school year. I remember it being a precious commodity because you only got one for the entire school year, or maybe two if you were high school. I tried to wait as long as possible before placing student information into my grade book. In the first few weeks of school it was inevitable students would transfer in and out my class and I did not want to have unattractive pages in my gradebook due erasures, white-outs, scratch-outs, or smudges. As much as I tried to avoid these errors, it happened anyway. Then I discovered the power of using a spreadsheet. I could do all kinds of calculations without unattractive pages.
Creating a simple grade book with excel.
Steps:
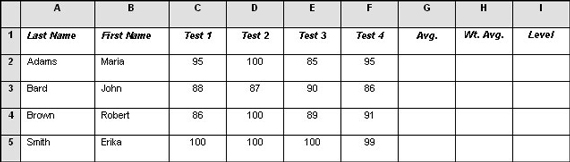
1. Identify what student information you want to include in your grade book. Example: Last Name, First Name, Test 1, Test 2, Test 3, Test 4, Average, Weighted Average, and Level.
2. Open MS Excel
3. Enter the data below into your spreadsheet.
4. Finding the average:
a. Highlight with your mouse all the test scores in row 2 for Adams, Maria (cells: C2, D2, E2, and F2). On the standard toolbar above, click the drop arrow next to Autosum (Σ) and then click Average. The average grade will appear in the adjacent cell (G2).
or
b. You can also enter a formula in G2 for the average. Click in cell G2 and type =average(C2:F2). You are telling it to calculate the average for a range of cells (C2 to F2).
5. Finding the weighted average. The weighted average is when each test is a different weight. For example: Test 1 is worth 20%, Test 2 is 30%, Test 3 is 40% and Test 4 is 10%.
Click in cell H2 and type =(C2*.20)+(D2*.30)+(E2*.40) +(F2*.10)
6. Converting percentage to a level scores of 1, 2, 3, or 4 (it could also be alphabetic grades, A, B, C, etc.)
a. First determine your ranges
90% -100% = 4
80% – 89.9% = 3
65% – 79.9% = 2
45% - 64.9% = 1
Everything else is a 0
b. Click in cell I2 and type:
=IF(H2>=90%,"4",IF(H2>=80%,"3",IF(H2>=65%,"2",IF(H2>=45%,"1","0"))))
Your product should be the following:
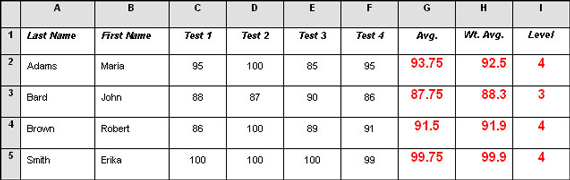
Hint: You don’t have to write the formula in each cell. In the Wt. Avg. column write out the formula for H2 and press “Enter.” Copy the results in H2 and paste it into H3. As you can see the formula adjusts for each cell in the column.
If you don’t have the patience or the time to create your own gradebook try these for free:
www.classroomwindows.com
www.gradelog.com
www.gradebook.com/ Do you have a question or comment about this article? E-mail Vanessa. |


