Using a
Spreadsheet
1. Using the
data we collected from our walkable survey, we
created a spreadsheet. On a large screen, I
taught the students the very basics of creating a
spreadsheet. Small groups of students took turns
calling out the responses to our survey. I
entered the "data" onto the sheet and
other students checked for accuracy. We realized
that there were some serious flaws in the method
we used to collect this information. This was
discussed with the students as we recorded the
information onto one group document. Some
students had not answered all of the questions.
How would this affect the outcome? Though we had
specified the area to be used for the survey,
there were still tremendous variations.
Did this compromise the data?
QUESTION: Why did we put the data onto a
spreadsheet?
Being
a Scientist isn't simple, is it?
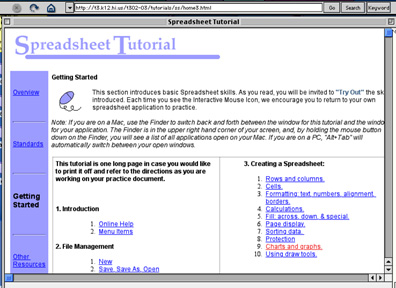
This
is a wonderful spreadsheet tutorial for teachers
and students. It is easy to
follow and comprehensive. It provides tutorials
for Appleworks (which we use at our school) and
Excel. I suggest that once you've collected your
data, you allow time for the students to review
this lesson using this tutorial.
http://t3.k12.hi.us/t302-03/tutorials/ss/home3.html
Our
Walkable Checklist
|
|
| |
YES
|
NO
|
1. room to
walk?
|
12
|
2
|
2.
sidewalks started and stopped
|
7
|
10
|
3.
sidewalks broken
|
15
|
3
|
4.
sidewalks blocked
|
10
|
6
|
5. No
sidewalks
|
3
|
15
|
6. Too
much traffic
|
4
|
13
|
7. was it
easy to cross?
|
10
|
5
|
8. road
too wide?
|
11
|
6
|
9. traffic
signals
|
12
|
4
|
10. need
stripped crosswalks
|
3
|
15
|
11. parked
cars block
|
3
|
14
|
12. trees
or plants block
|
2
|
12
|
13. need
curb ramps
|
1
|
16
|
|
Though we realized that
many errors had been made in our first attempt to
collect data scientifically, we knew that we had
gathered important information. We decided to
move on.
2. Once we had the information recorded on a
spreadsheet, we then converted the data into a
graph.
This section of the
spreadsheet tutorial will be very helpful.
This
site, Create a Graph, provides an alternate and
easy way to convert the data into a graph.

3.
Based on this chart, make predictions. What does
the class see as the biggest problems for
Pedestrian Safety?
THE QUESTION: What could the students do
with this information?
We had a chart, photographs, notes from the
Internet, information from interviews we had
conducted with the local school safety officer
and school crossing guard and personal
experiences. Was there a way to create projects
which would continue to challenge the students as
scientists?
NOTE: My students really became excited doing
spreadsheets. Many asked to work on their own
projects; converting data and creating charts.
They wanted to make this information their own!
Next year, I plan to create a separate unit based
on spreadsheets.
|