![]() Lesson Plan
#5
Lesson Plan
#5 ![]()
Pie Graphs

![]()
Duration: 2 to 3 days
Objectives: Students will:
Materials:
individual packages of
Skittles candies for students
-paper plates or napkins
-paper
-pencils
-crayons
Microsoft Excel or
ClarisWorks Spreadsheet Program
Make a Pie
Graph worksheet
Key Vocabulary
cells, spreadsheet, highlight, chart, graph, data, tally, percent
Procedure:
1. Before opening their
candy, students will examine the candy packages and determine the colors/flavors
of candies inside.
2. Each student will make an estimate of the number of candies they think are in
their package and write it down.
3. Students will predict which color/flavor will have the most candies.
4. Teacher will survey students asking if they think there are the same number
of candies in each package.
5. After opening their packages, students will sort their candies by
color/flavor.
6. Students will graph the number of each color/flavor found in their package
including a title and appropriate labels.
7. Students will write four things they can determine by looking at their graph
in question form.
8. Students will open the spreadsheet program and enter the data collected.
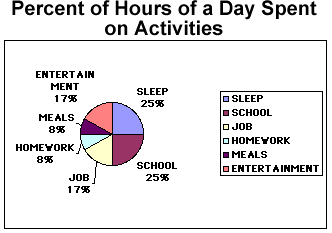
9. Once the data is entered, students should highlight the cells with information in them and make a pie chart. The chart should include the name of each flavor and the percent. Discuss with the students how the computer changed their tally numbers into percents.
10. Students can change the color of each piece of pie.
11. Students should add an appropriate title and clip art and print their work.
Assessment:
1. Students will share what
they learned from their graphs by asking the questions they have written about
their graphs.
2. Through discussion, help students think of other information they can get
from their graphs that may have been missed. (Which color/flavor had the most
candies? The least? How many more of one flavor were there than another? What
was the total number of candies? and so on.)
3. Students may enjoy eating their candy when finished.
Allow students to complete the Online Pie Graph Quiz and/or this Question & Answer Activity.
Home Learning:
Have students choose any candy they would like to create their own charts with. At home they may make a hand drawn tally chart and pie graph. At school they can input their data into a spreadsheet and create the graph, compare and contrast the hand drawn graphs with the computer generated graphs.
Extension Activity:
Have students research the national color distribution of Skittles or another candy and make two pie graphs for comparative purposes.
![]()