Pie Graphs
![]()

Background Information
![]()
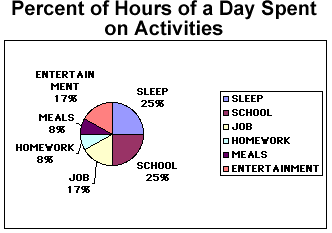
Circle graphs, also known as pie charts, are the best type of graph for showing the relative proportions of different categories to each other and to the whole.
Circle graphs are used when exact quantities are less important than the relative sizes of the parts.
|
|
|
|
Printables
|
|
![]()