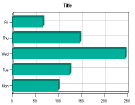
Simple Bar Graphs
![]()

Background Information
![]()
A bar graph is a visual display used to compare the amounts or frequency of occurrence of different characteristics of data. This type of display allows us to:
compare groups of data, and
to make generalizations about the data quickly.
|
|
|
|
Printables FAST FACTS ABOUT BAR GRAPHS WORKSHEET FIVE STEPS TO A BAR GRAPH WORKSHEET (Example) Of Bar Graph
|
|
![]()