|
|
| Home | Activity Two | Activity Three | Activity Four | Links |
|
|
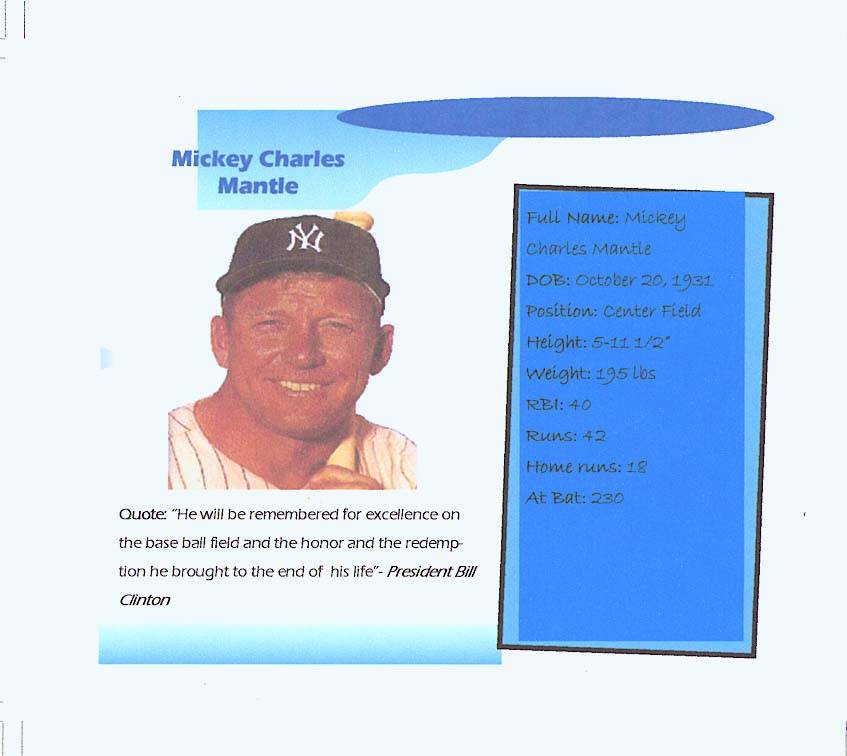
“Mickey Mantle stood at the top of the list in every category that baseball looks for in a player,
running, hitting, hitting with power, and defense.
It is no wonder that he became one of America’s true sport’s legends”
Earl Weaver on Mickey Mantle- quote located by Yvette, class 502
 |
Mickey Mantle t-shirt design created by class 6-107
Hearing a student say, “Everybody loves Derek Jeter, he is number one” inspire this activity I call "The Press Box". Here students will take on the role of an Internet, newspaper or magazine reporter in search of discovering who is the all time favorite Yankee. Students will write a survey/questionnaire and poll classmates and schoolmates, and students from other schools. The data collected will be tabulated, organizing into charts and graphs, interpreted and presented. Student will then publish their findings.
Calendar of Home Games:
A Timeline
A total of five 50-minute periods are needed, one for each part of this activity: writing the survey, conducting the survey, tabulating the data, organizing the data into charts and graphs, and presenting the findings.
Warm-Up Pitches:
Students need to know how to write and conduct a survey, how to make frequency charts, and how to read and interpret tables and graphs. How to use Excel is valuable but not necessary. Advanced students will benefit from lessons in determining the reliability of population samples, identifying misleading statistics and graphs, and in finding standard deviation.
The Batter’s Box:
Student generated surveys, a target population, and computer or pen and paper for charting, graphing, and presenting the findings. Microsoft Excel and a printer are optional. Internet Access is needed if student choose to poll classrooms outside the classroom.
Getting On Base:
Survey, target population, sample population, chart, line graph, bar graph, circle graph, x-axis, y-axis, frequency, frequency table, percent, mean, median, mode, range, and standard deviation.
http://library.thinkquest.org/11902/cgi-bin/allterms.html
Complete listing of baseball terms
http://library.thinkquest.org/11902/cgi-bin/search.cgi
Baseball and physics dictionary
http://baseball-almanac.com/rule2.shtml
Rules and regulations great listing of baseball terms vocabulary
Hitting for the Cycle:
Brainstorm-Ask the students, "Who is your favorite New York Yankee and why?" , and "How can we find out who is the most popular New York Yankee?" http://mlb.mlb.com/ Official Sites Major League Baseball- scoreboard, stats, standings, players, teams
Students work in groups to create a survey that will answer the question “Who is the number one New York Yankee.” The survey can be as simple as state your favorite Yankee or as complicated as limiting the response to a particular season game or position. Surveys can contain a complete or limited list of players
Students work in groups to create a survey that will answer the question “Who is the number one New York Yankee.” The survey can be as simple as state your favorite Yankee or as complicated as limiting the response to a particular season game or position. Surveys can contain a complete or limited list of player
Decide on a target population
Assign small groups of students to conduct the survey in the sample population. For example group A surveys the fourth graders, group B the fifth graders and group C the sixth graders
Individual groups tabulate, chart, graph, and interpret their findings
The class as a whole tabulates, charts, graphs, and interprets the combined findings of each group
Display finished charts and graphs
Discuss the merits of using a sample population to obtain data.
Students write a response of defense or rejection of the findings
The Pitcher’s Mound:
Web Sites of Interest
MVP:
Student Work
Student Baseball Cards
Includes samples
of student surveys and graphs
The Scoreboard:
|
5 |
Grand Slam |
Goes Beyond Expectations-all requirements are met and additional information, pictures and other graphics are included. Graphs are accurate and well designed. Work is neat, colorful and well organized. Students demonstrates outstanding team spirit
|
|
4 |
Home Run |
Meets all Expectations- all requirements are met. Graphs are accurate and well designed. The work is neat organized. Student demonstrates excellent team spirit.
|
|
3 |
Triple |
Meets Most Expectations: one major requirement is missing. One or two minor requirements are missing. Graphs are accurate. Work is neat and organized. Student demonstrates good team spirit.
|
|
2 |
Double |
Meets Some Expectations: Two major requirements are missing. Three minor requirements are missing. Format/organization needs work. Student demonstrates good team spirit. |
|
1 |
Single |
Falls Below Expectations: Three or more major requirements are missing. Four or more minor requirements are missing. Work lacks organization. Student does not always demonstrate good team spirit
|
|
0 |
Strike Out |
No attempt is made. Student demonstrates poor team spirit |
Comments and Suggestions: ______________________________________________________________________________________
_______________________________________________________________________________________________________________
Additional Assessment Ideas:
Assessment of the survey can be based on evaluating how well the students conducted the survey and tabulated the results. And how well they worked within the group.
Assessment of the graphs involves looking to see that all parts of the graph are included, (Titles, x-axis, y-axis, percents, etc.); the graph is readable, serves the intended purpose and is appropriate.
Classroom Observation and anecdotal notes
Conducting one-to-one interviews
Students poll their families and friends to create new graphs
Students create line graphs, Venn diagrams, or compare and contrast graphs involving two or more players.
Students use the data obtain from the classroom survey to create an assortment of graphs
Students defend their choice of graph
The Seventh Inning Stretch:
Students debate the validity of their findings and statistics in general
Students post their findings and completed surveys and graphs on a web page
Students use the Internet to poll children in other schools, cities, or countries
Students in groups research the most popular players, and compare their statistics
Students create different kinds of graphs discuss which format is the most effective and why.
Comments from the Coach:
Ask for permission to conduct surveys outside the classroom
If you need to conduct surveys in other classrooms as the teacher first
Provide students with clip boards to hold the surveys
Advise students of the role of a pollster and the type of behavior required
Explore the use of graphs in the media
Remind students that people are entitled to their own opinion
Explore and discuss how surveys are used in real life
Explore how the results of a survey can be unreliable or misleading
Post-Game Locker Room Interview:
Students love to communicate their thoughts and to find out what other people are thinking and feeling. Students who have a personal stake in presenting findings are more apt to pay attention to the details involved. Excitement over successful graphing one kind of graph that means something the students does in fact inspire them to want to learn about other ways of graphing data. And as simplistic as it seems, students learn best when they are engage and feel a personal stake in the outcome.
The Home Plate Umpire:
The Standards
Students will:
Communicate mathematically
Connect math to the real world
Collect, tabulate, organize, and interpret data
Draw and interpret charts and graphs
Present a display of information
Assess reliability in statistics
Make informed judgments
Find standard deviation
Read and write surveys
Prepare and deliver group presentations
Work cooperatively with others on a "team"
Demonstrate good sportsmanship
Employ appropriate forms of technology efficiently and effectively
Manage time appropriately to meet deadlines
 Go Yankees