Social
Studies Lessons for High School is designed for social studies teachers to use with their government and history courses. It was developed in response to a shift in education throughout our country: a move away from rote memorization and toward the critical thinking skills necessary for many of the new performance assessment programs.
Each lesson will enable teachers to teach seven specific critical thinking skills in a step-by-step process. The information has been adapted for old media and new media formats. Web sites will be provided that will allow teachers to choose the most appropriate resource for the selected activity. All selections can be copied for classroom use. Teachers may adapt activities to allow students to complete assignments via the web.
Bob
Black is former Teachers Network web mentor. He is a social studies teacher at the Harbor City Learning
Center, located across the street from the historic Edgar
Allen Poe House in Baltimore, MD.
Sample Student Template
Standard
Students will explain the influence of demographic changes on government policies.
Model for Interpretation
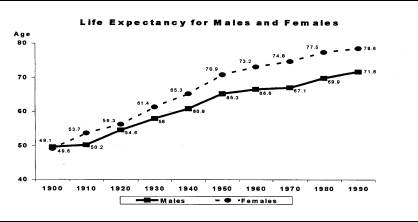
Life Expectancy for Males and Females
Q. What is the title of the chart, table, or graph? A. Life Expectancy for Males and Females
Q. What is the purpose of this chart, table, or graph? A. To show the change this century in how long people live.
Q. What do the labels/headings tell you? A. Ages on the vertical axis and decades on the horizontal axis. The
key shows which line is male and which is female.
Q. What key information does the data provide? A. The average age at which men and women died each decade.
Q. What is your main conclusion about this data? A. All people are living longer, but women live longer than men.
Q. How were you able to interpret this chart, table, or graph? A. By understanding that the numbers were the age at which death occurred and looking at the changes that occurred each decade