The Energy Transfer Multimedia Presentation
Topic: Energy Transfer Experiment Line Graph
Learning Objectives:
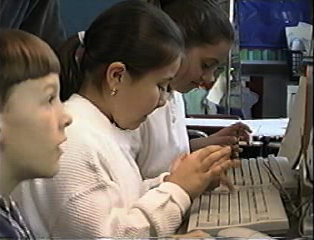
The students will enter their data from the energy transfer experiment onto an AppleWorks spreadsheet and create a line graph.
Previous Lessons: The students have completed the energy transfer experiment in science class. They have learned how to use spreadsheets from a program called, The Cruncher, (The Cruncher has built-in tutorials which allow the students to work on their own). The students have also used spreadsheet programs in computer class to create line graphs, bar graphs and pie charts.
Vocabulary: text box, data entry, input
Motivation:
Show the class a finished line graph and elicit how it is made. Which elements must you include
(labeling the data, title for chart, labeling of axes)?
Procedure:
-Motivation
-The students will open a new spreadsheet document,
-The students will label the spreadsheet (hot water, cold water, time: from I to 10 minutes
-The students will enter the data from their science notebooks under the proper headings;
-The students will create a line graph, including labels for the data, axes for the graph, and a chart
title;
-The students will create a text box in the spreadsheet, and copy their hypotheses and their
results from the science notebooks.
-The students will explain their completed line graphs to the class. They will state their original hypotheses and explain the results they got from the experiment.
Materials: computers, science notebooks
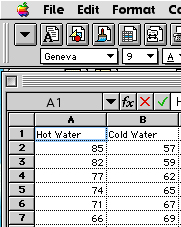
Enter the data
|
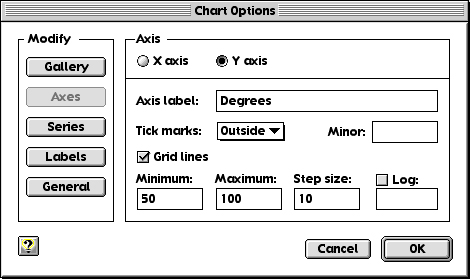
Name the axes
|
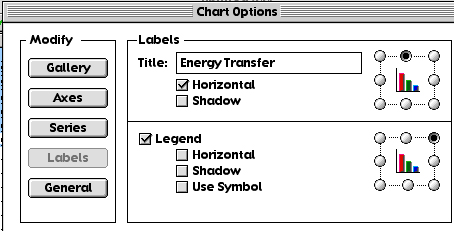
Give the chart a title
|
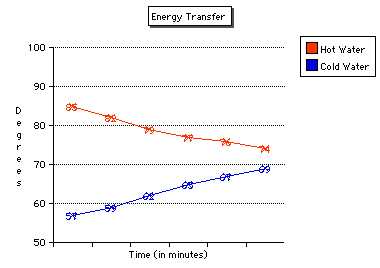
The finished chart
|
Standards:
M4a The student collects and organizes data to answer a question or test a hypothesis by
comparing sets of data
M4b The student displays data in line plots, graphs, tables, and charts
M4c The student makes statements and draws simple conclusions based on data; that is:
-reads data in line plots, graphs, tables, and charts
-compares data in order to make true statements, e.g., "seven plants grew at least 5 cm