![]() Lesson Plan
#3
Lesson Plan
#3 ![]()
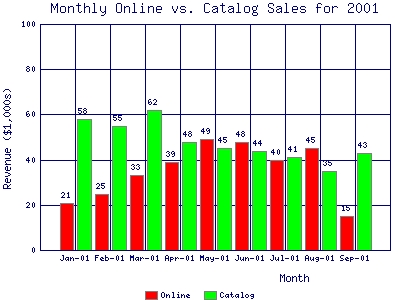
Comparative Bar Graphs

![]()
Duration: 2 to 5 days
Objectives: Students will
Make a comparative bar graph
Understand the basics of a spreadsheet
Highlight cells in a spreadsheet
Become familiar with the terms x-axis and y-axis
Choose a graphic to import into the spreadsheet
Materials:
Spreadsheet program
Clip Art
Introduction to Excel Tutorial
Introduction to Claris Works Spreadsheet
Key Vocabulary
cell, row, column, spreadsheet, x-axis, y-axis
Procedure:
1. You will need to get data from another class in order to do the comparative graph on individual student's favorite sport. You can compare more than two classes for older students. Choose a maximum of four sports (football, baseball, basketball, soccer) Survey your classroom and then the other to individually identify the one that s their favorite. Keep the classroom data separate.
2. After students open Excel or Claris Works, explain to them that they are going to be working with a spreadsheet program which will automatically convert the data they enter into a graph.
3. Draw a spreadsheet on the board and identify a cell, a row, and a column. Have the students give you the “address” of several cells until you are sure they understand how a spreadsheet is laid out. Make sure that the students know the terminology.
4. In column A have the students type in the names of the football, baseball, basketball, and soccer. IMPORTANT! Begin in cell A-2. Cell A-1 must be left empty. In Row 1 beginning at B-2 have the students type in the names of the teachers whose students are participating in the activity. Then have students enter the number of students in each classroom who chose the different sports as their favorite.
5. Show students how to highlight the spreadsheet cells in Columns A and B
using the “click and drag” process.
6. Add the graph on the screen. Students will choose a bar graph.
7. Students add the title, X-axis title, and Y-axis title.
8. Allow students to cut and past clip art from another program to make it more attractive.
Assessment:
Have the students write math word problems using the data collected. The teacher will compile the problems and create a test to assess students' understanding of comparative graphs.
Home Learning:
Students will collect data on a topic of their choice. They will draw a comparative bar graph using the data collected.
Extension Activity:
Students can go online to collect data to compare and create a comparative graph on a variety of topics such: weather, sports statistics, etc.
Sports Illustrated Baseball Stats
![]()