![]()
Component: Statistics, probability and graphing
Objectives: To gather and interpret research results
To graph relations and functions to recognize trends
To create and read circle and bar graphs containing common percents and
fractions
To use statistical data about life situations to make predictions and justify
reasoning
Materials: Computer with online access and chart making ability
Procedure:
Students will search for reliable statistics on
health effects of smoking and
the age when people begin to smoke
This information will be placed onto charts
Students can create charts online at: Global Classroom and Online Graphing
Students will analyze data and answer questions on Graph
Review
Evaluation: Students will identify all the parts of the graph
and label accordingly, i.e.
title, horizontal and vertical axes, proper integers, and write two appropriate
statements comparing the data.
Homework: Students will make a pie chart by surveying people on their favorite candy, movies, or fast food.
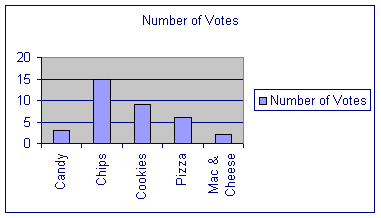
Extended Activities: Favorite Foods Column Chart
Students will create a Favorite Foods Column Chart using Microsoft Excel
Open a new spreadsheet
Survey the class to determine favorite after school snacks
Graph the results in a spreadsheet
| Favorite Treats | Number of Votes |
| Candy | 3 |
| Chips | 15 |
| Cookies | 9 |
| Pizza | 6 |
| Mac & Cheese | 2 |
Widen columns as needed
Select all cells used
Click on Chart Wizard and choose column

Websites to Visit: