 Lesson Plan- Weather Tracking
 Lesson Plan- Weather Tracking
Component
The student will analyze real-world date to recognize patterns and relationships of measurements using tables, charts and graphs, including calculators and computers.
Objectives
CLOUD CHART
| Cloud Chart | Day 1 | Day 2 |
Day 3 | Day 4 | Day 5 | Day 6 | Day 7 |
| High: | |||||||
| Cirrus | |||||||
| Cirrocumulus | |||||||
| Cirrostratus | |||||||
| Middle: | |||||||
| Altostratus | |||||||
| Altocumulus | |||||||
| Low : | |||||||
| Cumulus | |||||||
| Nimbostratus | |||||||
| Stratus | |||||||
| Stratocumulus | |||||||
| Cumulonimbus | |||||||
| Total Checks | |||||||
| Have students check clouds seen on each day. | |||||||
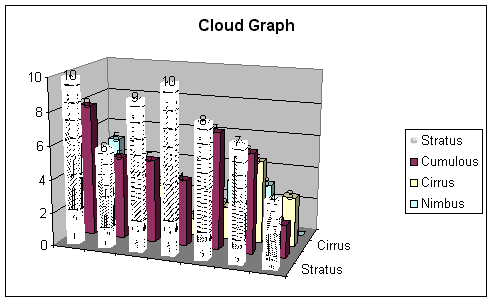
Example of Student-Crated Cloud Chart Using Spreadsheet/Table Application
Competency
The students will track weather patterns, such as daily cloud formations, and create charts and graphs to reflect data.
Homework
Go outside with parents and determine the types of clouds in the sky at that time using Cloud Chart.
Field Trip
Go on a virtual field trip to learn how Earth looks from space; click on Astronaut Photography, then Deltas at NASA Earth Observatory
Resource
Wilson. F. The Weather Pop-Up Book. Simon and Shuster. New York. 1987.