
|
|
Note: This lesson would be the third in a unit
revolving around a modified Stock Market Game. Lesson #1 would introduce
the game, explaining the objectives and rules of the game. At that time
cooperative learning groups would be formed and roles of each students
would be chosen. These roles include: group leader, technology coordinator,
researcher, secretary or recorder, reporter, graphic artist, journal writer,
etc. The objective of lessons #2-4 would be two read, interpret, and analyze
stock reports, graphs and charts. During Lesson #6 students in grades 5-6
would be given a pre-selected list of 25 stocks to choose from in planning
their investment portfolio. Stocks would be grouped by sectors such as
banking, technology, transportation, oil, health, pharmaceuticals. For
children in grades 7-12 students might be able to choose from an unlimited
list of stocks. The criteria set up in lesson #5 would be used by the students
in evaluating stocks as possible investment options during lesson #6. The
above mentioned lessons will be posted to the TeachNet site at a later
time.
Although I refer to the following as a lesson,
it may take 5-6 forty five minute periods, depending on the age level,
ability level, and computer experience of the students, to complete this
lesson.
Aim:
1. To use
the Internet as a research tool
2. To appreciate
the need to formulate criteria before investing in a stock.
3. To analyze
information to form criteria in choosing stocks to invest in
4. To read
factual information and discriminate between information which may or may
not be valuable in formulating criteria.
5. To use
a drawing program to create a semantic web
6. To use
a database application to organize focus questions
7. To
share ideas with other students
8. To
develop respect for other students' opinions
Setting:
This lesson
could take place in a computer lab or in a classroom setting in cooperative
learning groups. In class of thirty students, six groups would be formed.
Materials:
Computer with
Internet capabilities, drawing and painting application such as Superprint
or Kidpix or tool software such as ClarisWorks, database application such
as ClarisWorks or Microsoft Works.
Vocabulary:
| investment | criteria | assets | liabilities | expense ratio |
| annual report | revenue | net profit | profile | sales |
| stock | net income | share | sector | split |
| price per share | stock | industry | earnings | capital |
| symbol | market cap | company name | price/earnings ratio |
Motivation:
1. Each
cooperative learning group of students will be investing $100,000. in as
part of the stock market game. The group with the greatest profit at the
end of 8 weeks will receive trophies.
2. Students
will obtain quick access to multimedia displays of information via the
Internet.
3. Students
will develop pride in being able to create a finished semantic web and/or
database on the computer and print out the document.
4. Teacher
will demonstrate with a LCD display projected for the entire class to see,
how to find stock reports, quotes, and news article related to stocks on
the Internet. On America Online's channels window, click on Personal Finance.
Enter stock symbol or use the Symbol Lookup feature by entering the company
name. Then click Get Quote. Use Dell Computers (symbol - dell) as an example
of a stock to explore. Examine the information given in this section. Elicit
from students which information will be important in ascertaining whether
or not this company would be a good investment choice. Formulate into criteria
and add to semantic map. (New criteria might include: 52 week high and
low, market cap, p/e ratio).
|
|
|||
| LAST TRADE | 32.7/8 | Volume | 25,860,400 |
| CHANGE | -0.75(-2.23%) | Avg Volume | 39,272,750 |
| BID | 32 13/16 | Mkt Cap (mil) | $86,026.25 |
| ASK | 32 7/8 | PE | 48.3 |
| OPEN | 33 3/4 | Div Yield | N/A |
| PREV. CLOSE | 33 5/8 | Annual Div/Shr | N/A |
| DAY'S RANGE | 32 1/2-34 | Ex-Div | N/A |
| 52 WEEK RANGE | 32.75-59.68 | Market | Nasdaq |
At the bottom
of this window is a News section. Click on links to available news articles
related to the stock. Elicit the information from each article that would
be useful in determining whether Dell is a viable investment company. What
current events effect the stocks performance? Formulate additional criteria
and add to web.
| Wed Sep 27, 2000
. Dell cuts server prices Hosted by CBS MarketWatch - 01:17 PM EDT . Dell Cuts Server Prices -2: Cuts PowerEdge 6400 Price 47% Dow Jones - 01:15 PM EDT . Dell Reduces Server Prices by Up to 47 Percent Business Wire - 01:01 PM EDT . Zoho Confirms Buys National Content Liquidators Dow Jones - 10:25 AM EDT Tue Sep 26, 2000
Older Stories |
Additional URL's to try containing quotes, analyst's
reports, news articles, information on stock splits, and stock histories
are:
http://wsj.com
http://marketwatch.com
http://bloomberg.com
http://multexinvestor.com
http://the street.com
http://money.com
http://stockplayer.com
Procedure:
1. Brainstorming
and discussion: What would you need to know about a company before you
invest in it? Responses may include but not be limited to: type of company,
what the company produces, how much the company is worth, how much money
the company made in the last year. Record responses on a semantic map on
the chalk board.
2. Break
into cooperative learning groups.
3. Repeat
the process of finding information about a stock as demonstrated by the
teacher in the motivation of the lesson. Students will explore AOL's investment
snapshot window, charts, investment research, and news section for one
or two other companies such as Mobile Oil or Ford Motor Corporation.
4. Students
brainstorm with their cooperative learning group to set up additional criteria
for choosing a stock and add the criteria to their semantic webs.
5. Students
share their criteria with the class. Students evaluate each other's criteria.
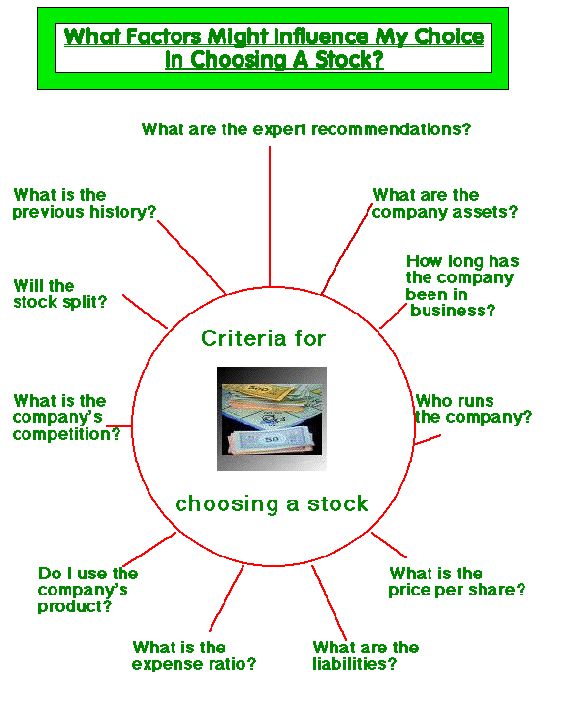
6. Students
use a drawing and painting application such as Scholastic's Superprint,
Broderbund's Kidpix, or ClarisWorks to draw a semantic web with the stock
criteria information on it. Students print and display their work. See
sample semantic web.
 |
7. Students use a database application such as ClarisWorks to list criteria in the form of focus questions and print out their work. See sample focus questions.
CRITERIA FOR CHOOSING A STOCK
| What are the expert recommendations? | |
| What is the previous history? | |
| Will the stock split? | |
| Do I use the product? | |
| What is the expense ratio? | |
| What are the company's assets? | |
| What are the company's liabilities? | |
| What the company's competition? | |
| Who runs the company? | |
| How long has the company been in business? | |
| What is the price per share? |
Evaluation:
Students will
be evaluated on the effectiveness of their finding locations on the Internet
for researching stocks. The quality of the semantic web and database created
as well as the criteria established will be evaluated by the teacher.
Follow Up:
Students will
use the database and semantic web as a template for evaluation stocks for
possible investment. Students will record their findings on the template
using one template for each stock they research. See sample database template.